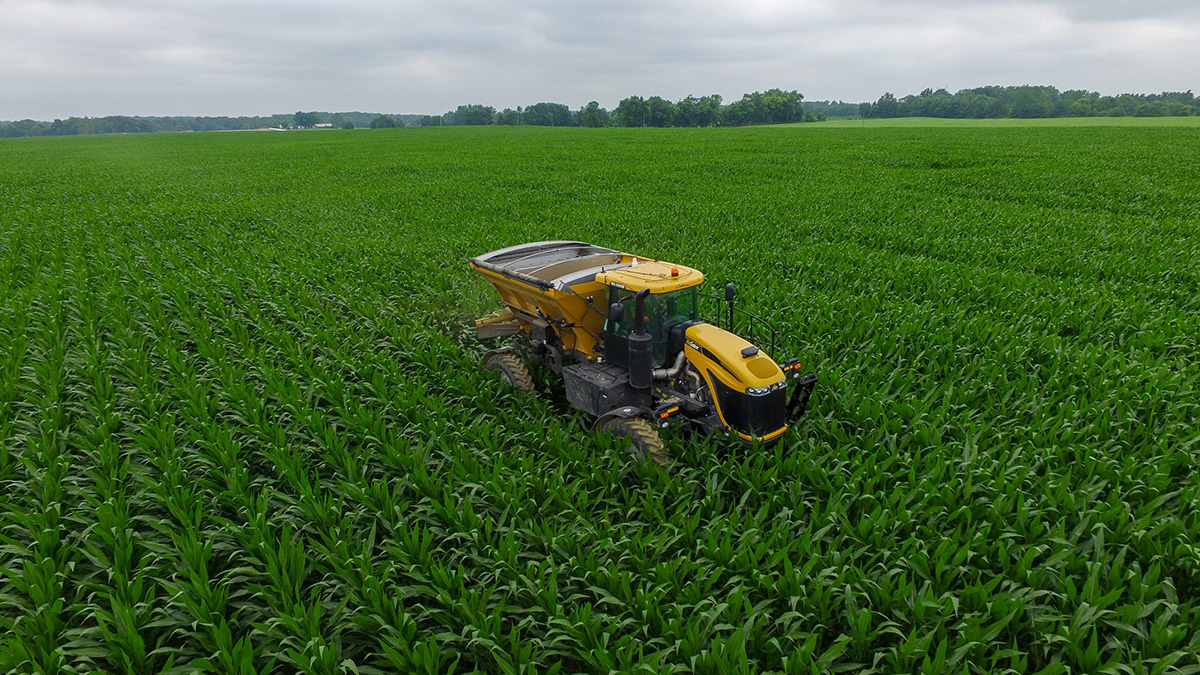
Nathan Lykins/realagstock
Listen: Nebraska FARMcast
Introduction
This article updates our previous articles on ever-changing world fertilizer markets and associated energy markets (Beghin and Nogueira, 2021; Beghin, 2022). This update reports historically high prices that appear to be declining from their peak, earlier in 2022. However, the situation is still dire in Europe. The report also provides a more in-depth discussion of the impact of fertilizer prices on affordability accounting for technical progress in farm technology to economize on fertilizer use in the last half-century. This progress has helped mitigate the impact of fertilizer price hikes.
Recall the volatile context of high fertilizer demand, droughts affecting fertilizer supply, high-fossil energy prices, supply chain disruptions, trade policies, and the Ukraine-Russia war, which led to elevated fertilizer nominal prices to levels not seen since 2008. As in the previous articles, we start with recent developments in natural gas prices and continue with their implications in fertilizer prices. We then address fertilizer affordability relative to crop prices. Finally, we qualify the trend in lower affordability by looking at productivity gains and fertilizer-saving technology in crop production in the last 50 years using productivity data from USDA. We document that farmers have been increasing crop production faster than they have expanded fertilizer use, especially in recent decades. The cost of fertilizer as a share of crop value (before farm program payments) has been variable but with a pretty flat trend.
Natural gas prices in world markets
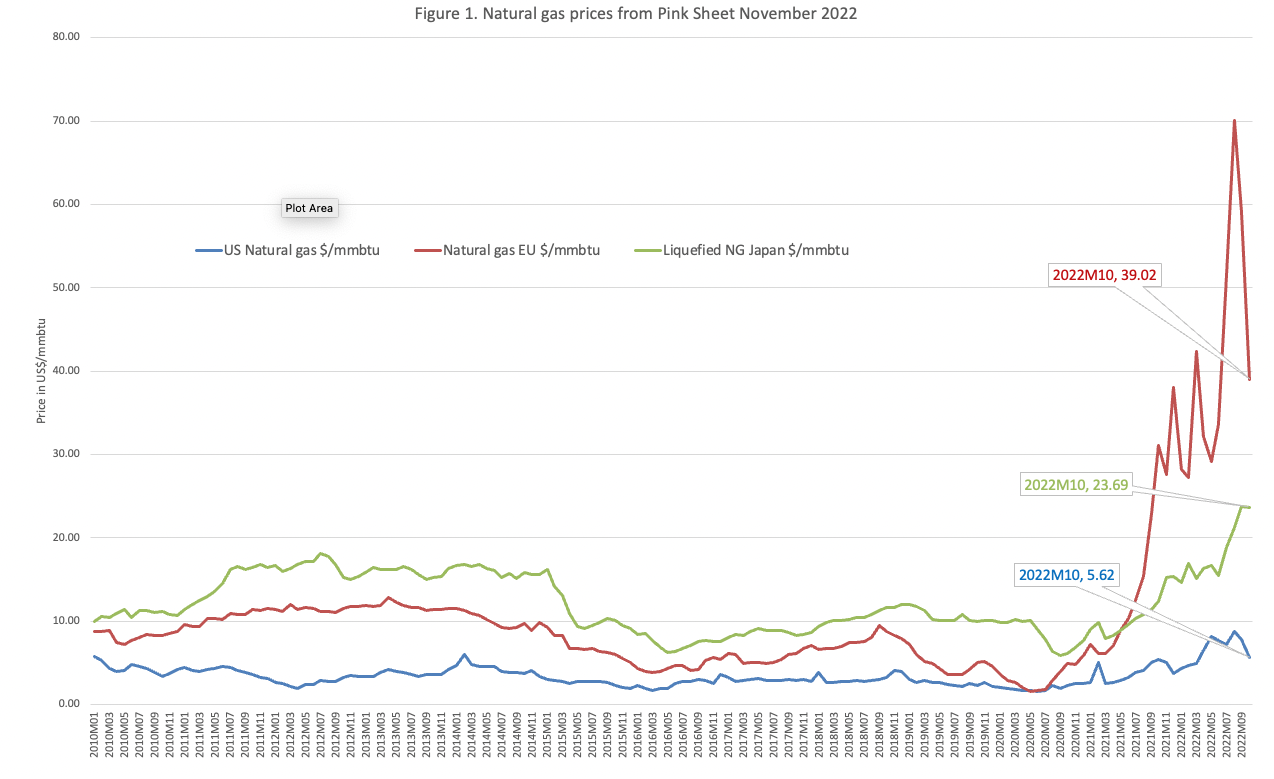
Natural gas prices are shown in Figure 1 for the U.S., EU, and Japanese markets. Prices in Europe and the U.S. peaked in the summer and have been falling since. EU prices were hovering around $39/MMBTU (One Million British Thermal Units), in October (latest data available from the World Bank’s Pink Sheet) and $30/MMBTU below the peak of August 2022. U.S. prices have receded to below $6/MMBTU, from $8.79/MMBTU in August 2022. Prices for liquefied natural gas in Japan are just below $24/MMBTU in the last two months, at their highest levels. While remaining elevated by any standards, the decrease in EU and U.S. prices lowers pressures on fertilizer production costs.
The price differential for natural gas across markets creates incentives to export from lower-price areas to higher-price areas. However, the infrastructure to export natural gas to Europe outside of the established infrastructure for Russian supplies takes time to be established, including in the U.S. The cost of liquefied natural gas terminals is high and new environmental policies to reduce the use of fossil fuels create uncertainty on the future return of this infrastructure, especially once the Russia-Ukraine war concludes and sanctions are removed.
Fertilizer world prices
Fertilizer prices are shown in Figure 2. The series show DAP (diammonium phosphate), Phosphate rock, Potassium chloride (potash), TSP (triple superphosphate), and Urea. The price of DAP, TSP, and Urea peaked around May 2022 and have continued their downward trajectory. These prices tend to follow the evolution of natural gas prices since these fertilizer mixes contain nitrogen produced with natural gas or rely on processes that are natural gas intensive (like TSP). These prices remain elevated and remain expensive, even with their downward trajectory. The prices of potash and phosphate rock remain at their highest levels, however.
The high cost of EU fertilizer in 2021 has been exacerbated by the war and associated sanctions against Russia and Belarus. The sanctions in principle spare agriculture and its inputs. In practice, the carving out of these sectors from sanctions has not worked as intended. Belarus potash has been sanctioned and exports cannot transit through EU countries. Russian potash has also been sanctioned to avoid potash from Belarus being reflagged as Russian potash. Individual EU countries (member-states of the EU-27) also have the discretion to issue waivers (exemption from sanctions) or not, for other fertilizers coming out of these two countries and going to third parties. This situation creates some uncertainty (Glauber and Laborde, 2022). The added red tape with banking restrictions and sanctioned oligarchs create incentives to all-together avoid Russian fertilizer and consider alternate sources. Since last year, Russia has self-imposed export restrictions to mitigate price increases in domestic markets (Glauber and Laborde, 2022).
Other trade restrictions self-imposed on exports by China and other countries did not change since the last September update according to IFPRI’s inventory of fertilizer trade restrictions. Chinese restrictions are expected to end in December 2022.

Fertilizer cost in farm revenues and revisited affordability
The fertilizer affordability ratios shown in Figure 3 are the ratio of urea fertilizer price ($/mt) to the corresponding corn price ($/mt) and the ratio of fertilizer price index to the crop price index. The affordability ratios are used to capture the impact of high fertilizer prices on farm profitability in a succinct way. Additionally, we compare the affordability ratio and the trends showing deterioration of affordability (the price ratio is trending up) to the cost share of fertilizer in the value of gross output. We use USDA data from 1975 to the end of 2021, the latest available year. The cost share of fertilizer in the gross value of output and in total cost of production is shown in Figure 4. The figures rely on annual data, which smooths out the monthly variability. Here we focus on the underlying trends for the nearly five decades covered by the figures.
The affordability ratios in Figure 3 show increasing trends, which means that fertilizer per unit cost is increasing its share of the unit price of the crop. However, Figure 4 shows a mixed picture. As a share of cost of crop production, fertilizer cost first decreased and then started increasing in the late 1990s. As a share of gross crop value, fertilizer cost hardly shows any upward trend, suggesting that the increase in the price of fertilizers relative to crop prices has been accompanied by decreasing fertilizer use per bushel produced.
This observation is corroborated by agricultural productivity analysis by USDA ERS. The latter estimates that crop output grew faster than fertilizer use, especially starting in the mid-1990s, implying a lower use per unit of output over time in recent decades. The difference between the growth rates of total crop production and fertilizer use is shown in Figure 5. There is a lot of variability in the growth rate differential (crop growth rate-fertilizer use growth rate) but the trend clearly indicates a transition from the intensification of fertilizer into crops in the 1970s to fertilizer-saving technologies in more recent years. This change was brought about by more accessible soil testing, better fertilizer-release formulation, improved technology to apply fertilizer (for example: split applying nitrogen, applying fertilizer through irrigation, among others) and precision agriculture.
In summary, while fertilizer prices remain high and uncertainty remains (energy prices, trade policies, the Ukraine-Russia war, etc.), there has been some recent good news due to declining fertilizer prices. Taking a more in-depth look at affordability suggests that technological advances have helped reduce the share of fertilizer use in crop production. While the share of fertilizer use to gross value has remained constant, the fertilizer cost/gross value risk for 2023 remains as grain prices are fluctuating and yields will not be revealed until fall 2023.


Figure 5. Total Crop Annual Growth Net of Fertilizer Use Growth Rate from TFP USDA ERS data
Enlarge in new tab
References
Beghin, John C., and Lia Nogueira. A perfect storm in fertilizer markets. Briefing paper No. 1723-2021-3109. 2021. https://ageconsearch.umn.edu/record/316020/
Beghin, J. The Storm in World Fertilizer Markets Continues. Cornhusker Economics September 28, 2022. https://cap.unl.edu/crops/storm-world-fertilizer-markets-continues
Glauber J., and D. Laborde. “How sanctions on Russia and Belarus are impacting exports of agricultural products and fertilizer,” IFPRI Blog: Issue Post November 9, 2022. https://www.ifpri.org/blog/how-sanctions-russia-and-belarus-are-impacting-exports-agricultural-products-and-fertilizer
USITC. Urea Ammonium Nitrate Solutions from Russia and Trinidad and Tobago. Investigation Nos. 701-TA-668-669 and 731-TA-1565-1566 (Final). Publication 5338, August 2022.
The World Bank. World Bank Commodities Price Data (The Pink Sheet), November 2022. Prospects Group, The World Bank. https://www.worldbank.org/en/research/commodity-markets