This article is a republication of an article first posted in September 2021.
This article provides information related to the University of Nebraska-Lincoln's Harvest Moisture Calculator online tool.
Looking for the tool?
When to send out the combine represents a critical decision every producer across the nation faces. At first glance, there seems to be a simple answer: “whenever the grain dries down enough, of course.” However, producers know the decision comes down to much more than just moisture. Other factors, such as acres to harvest, precipitation, storage space, current market conditions, time constraints, and weather events, contribute to an irregular harvest window from year to year. No matter the condition, there exists a chance of observing an undesirable financial outcome. Given that harvest often begins with grain moisture, and having the awareness that bad events (wind, hail, etc.) can happen, how can one effectively manage their revenue risk in the face of these ever-changing conditions?
The objective of this article is to discuss the financial implications of beginning harvest and harvesting through varying moisture levels. To do this, we will introduce an online tool that considers the role of grain moisture, elevator discounts, grain price and a harvest window in determining the optimal time to begin harvest. The insights from the virtual tool may prove valuable to the producer’s harvest decision. We hope growers consider taking a deeper look at the influence crop moisture level has on their net revenue.
As previously indicated, deciding when to start harvest is no simple matter, as there are many variables that factor into the decision. Of all the variables, weather is the most difficult to anticipate. The unpredictability of the weather forecast can upend harvest plans across the country and create harvest windows that fluctuate greatly from week to week and year to year. Other aspects, such as harvest acreage, storage space, grain price, and cash flows, are specific to the operation and should be weighed in individually by the grower. Moisture level, however, is one factor common to all producers affecting timing of harvest.
Managing grain moisture level embodies a double-edged sword. Harvesting at higher moisture levels may take up additional valuable time, be more costly if equipment adjustments and drying are required and be subject to discounts and shrink at delivery. On the other hand, harvesting at lower moisture levels may result in higher yield loss risk, excess shatter loss, and fewer pounds to sell at delivery. One may ask: “is there any way to win?” To identify a best course of action, buyer discounts from delivering wet grain and inherent discounts from delivering dry grain need to be discussed further.
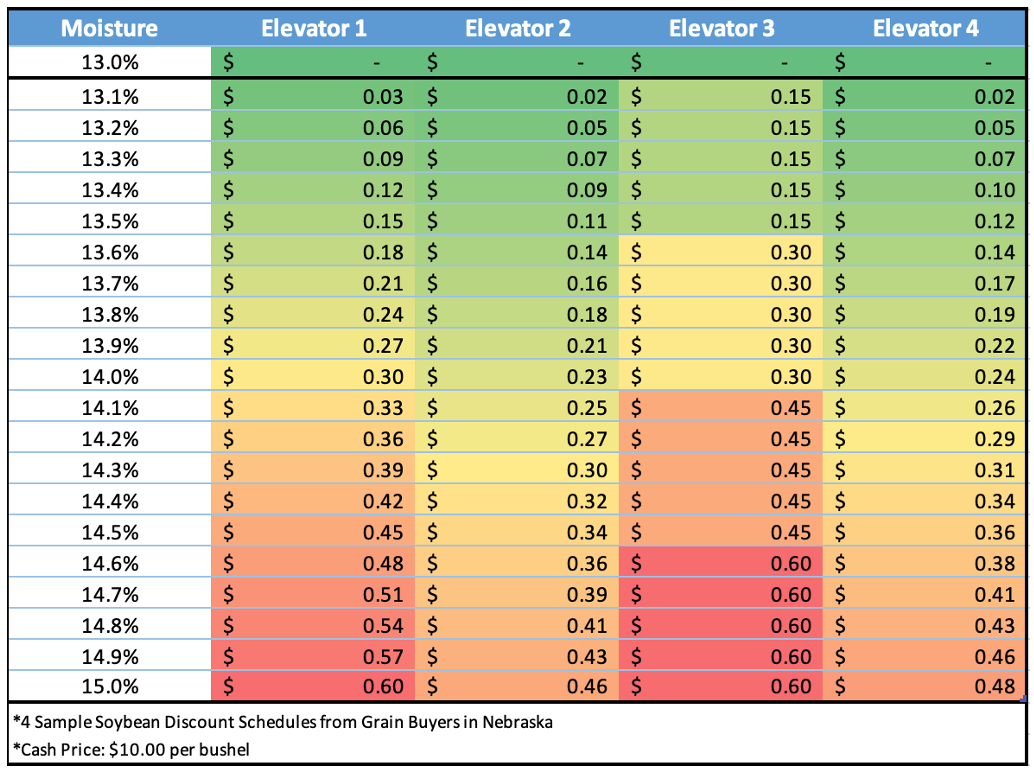
When delivering grain to buyers, the bushels are subject to monetary discounts when the moisture level of the grain exceeds a specific percentage. This moisture level where discounts begin is generally consistent among grain buyers: 15.0% for corn, and 13.0% for soybeans. For this article, 15.0% moisture for corn and 13.0% moisture for soybeans will be indicative of “the maximum acceptable moisture without a discount”. Although these moisture levels are typically standard, grain buyers can vary in the type of discount schedule they offer, charging the seller differently after the 15.0% or 13.0% moisture level is exceeded (see Table 1). Both the rate and the way discounts are enforced can vary from one buyer to the next. For example, a local elevator may enforce a flat per bushel fee for each 0.5 moisture point over 15.0%, while another elevator may charge an increasing per bushel fee for each 0.1 moisture point over 15.0%. In addition to this, some buyers may include “shrink” in their discount schedule, essentially adjusting delivered bushels downward to account for excess water weight. Using shrink, the buyer converts the total bushels from a “wet” truck load to the bushel amount equivalent had the grain been dried down to the 15.0% or 13.0% levels, thereby accounting for the weight lost through the drying process. Although not the focus of this article, grain can also be discounted according to factors such as foreign material, test weight, and overall damage. Growers should inquire of buyer’s discount schedules prior to delivery to avoid heavier discounts on their grain than expected.
Table 1: Sample Elevator Soybean Moisture Discount Schedules
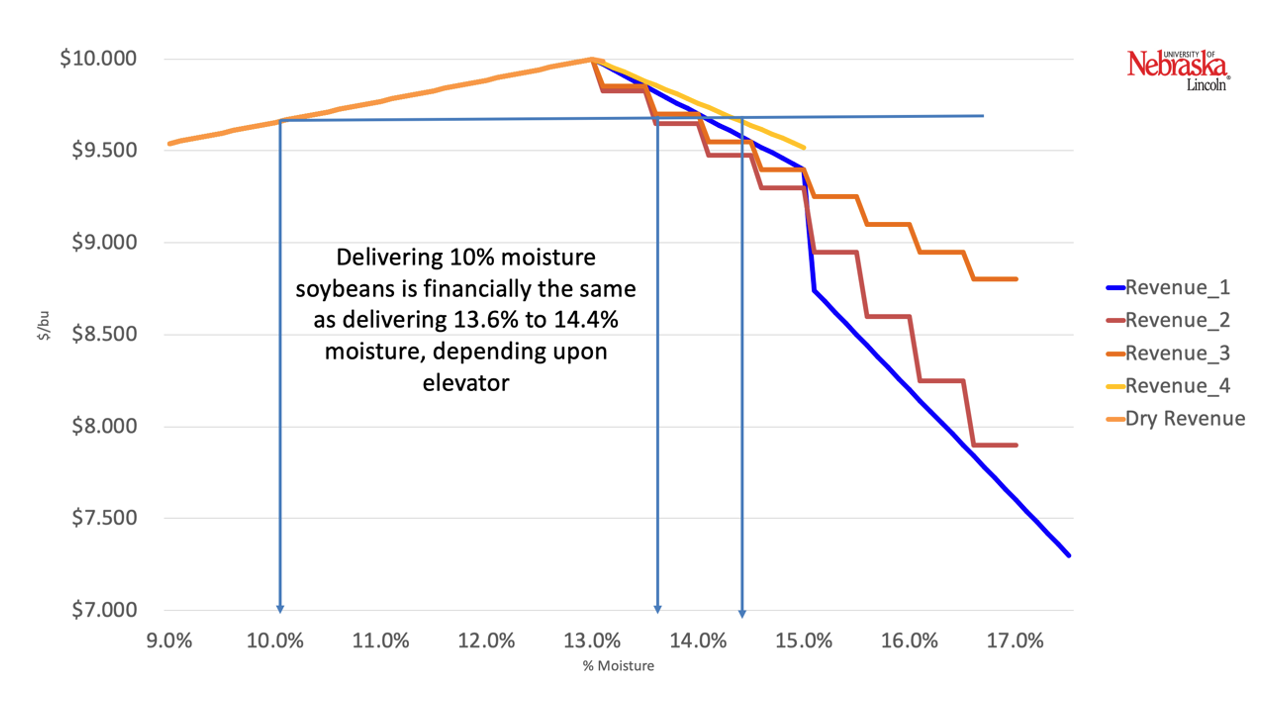
Considering the other edge of the sword: delivering commodities at moisture levels below the 15.0% and 13.0% discount levels is not without cost. While bushels delivered below these levels will avoid observable discounts from grain buyers, they are subject to lower returns than those delivered exactly at 15.0% and 13.0%. The reason: every pound of water removed below this level is a pound removed from the truck at the scale. This pound of water goes uncompensated, dried free of charge by the farmer. Let's look at an example for some perspective: take 60 pounds of soybeans (1 bushel) delivered at the 13.0% moisture level. Under these conditions, there are 52.2 pounds of dry matter and 7.8 pounds of water in the bushel of soybeans. Now, if these soybeans were delivered at a 10.0% moisture level, the 52.2 pounds of dry matter would remain, but there would be only 5.8 pounds of moisture. Thus, the elevator would receive 58 pounds of soybeans, 2 pounds less than if delivered at 13.0% moisture. Assuming a cash price of $10.00, the farmer would receive $0.33 per bushel less by delivering the drier beans. For a typical 1000-bushel load of soybeans, this is $330 left on the table. This may come off as relatively steep, but let’s compare this to an equivalent dollar reduction from buyer discounts. Referring to Figure 1, delivering soybeans at 10.0% moisture is financially the same as delivering at 13.6% to 14.4% moisture, depending on the grain buyer.
Figure 1: Soybean Moisture Discounts in Relation to Price
Notes:
- Revenue 1 – Revenue 4: Discount schedules sourced from four sample grain buyers in Nebraska
- Dry Revenue: Dollar per bushel price equivalent associated with moisture levels below the discount level
- Cash Price: $10.00 per bushel
Now that we have laid out the problem with harvest moisture, let’s get back to the question: “is there any way I can win?” In the theoretical world, growers would want and be able to deliver all their bushels at the 15.0% and 13.0% moisture levels. But as we know, this is impossible. Growers will incur discounts whether the discounts are explicit (elevator discounts), or implicit (delivering fewer pounds from a drier crop). Thus, it should be the goal of the producer to keep these to a minimum: cutting implicit and/or explicit discounts back, leaving more money in their pocket.
The Harvest Moisture Price Calculator can aid the grower in achieving just this. This online tool can predict an average price received based on the operation’s delivery moisture levels, buyer discount schedules, implicit discounts from drier grain, and cash price. The moisture range (i.e., harvest window) can be chosen based on the moisture levels anticipated upon delivery, and cash price can be adjusted according to current market conditions. Several different discount schedules from grain buyers in Nebraska/Kansas are included, as well as the implicit cost of delivering at moisture levels below the discount level. For each grain buyer, an average price per bushel is calculated based on the user’s selected conditions. Additionally, the user can view the discount difference between the least cost location and the alternatives on a per bushel, per truckload, and overall basis. This can prove valuable when deciding location of delivery, and it also reveals the cost involved in that decision.
To accommodate harvest moisture differences between crops, separate moisture calculators have been developed for both corn and soybeans. The online tools are specific to conditions faced for each crop. And while we capture financial outcomes related to moisture, we do not capture other possible environmental effects. For instance, low-moisture soybeans are much more susceptible to shatter loss than low-moisture corn. As a result, harvesting drier soybeans may prove more costly. Additionally, corn and soybeans differ in their vulnerability to weather events such as hail and wind. Thus, when evaluating when to start harvesting based on moisture, the risk of crop damage from other events should be considered, in addition to these decision-making tools.
Harvest Moisture Price Calculator (Corn and Beans)
Notes:
1. Discount schedules were sourced from grain buyers in Nebraska/Kansas for Harvest 2020
2. Price discounts observed below the discount level are equivalent to the dollar per bushel amount forgone from lost water weight
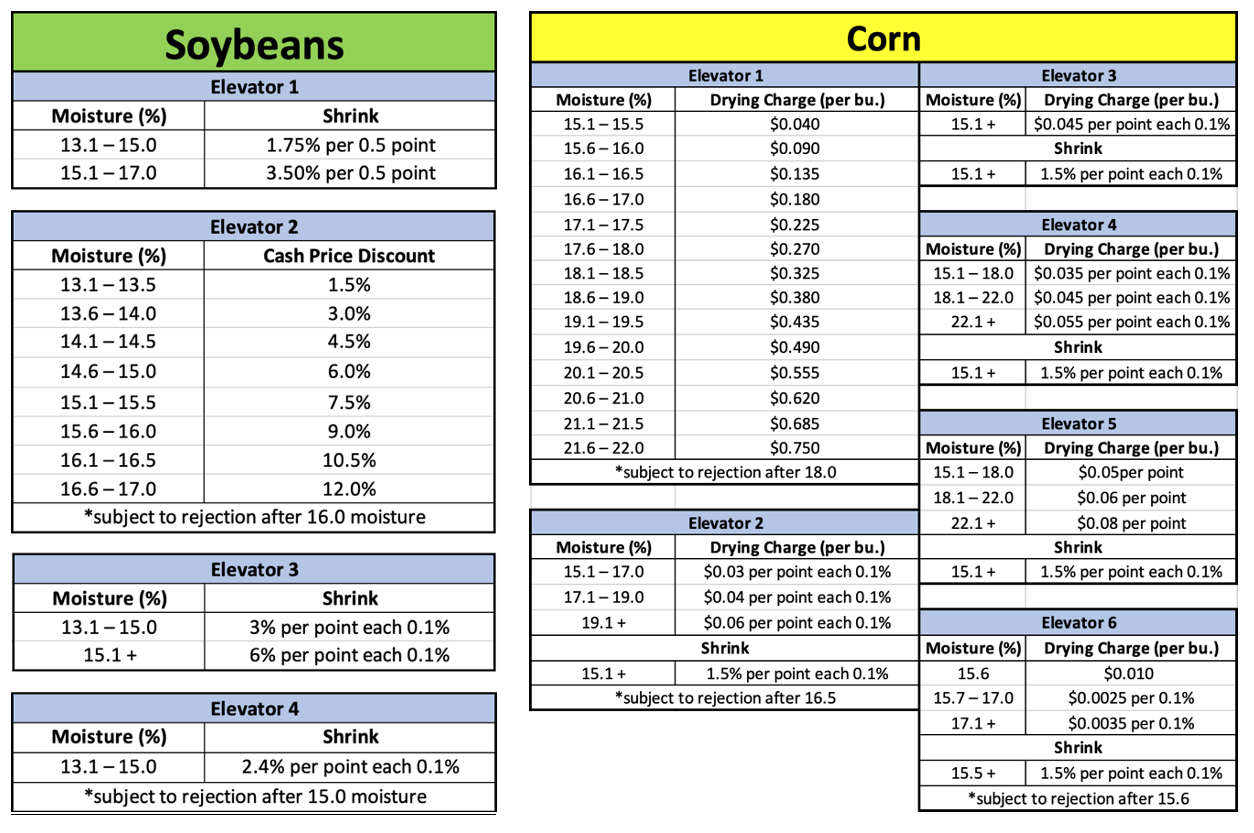
To fully utilize the tool, we recommend first inputting the current cash price and your bushel amount, and then identifying discount schedules similar to the locations you deliver to. See Table 2 below for the discount schedule details used in this online tool.
Table 2: Buyer Discount Schedules for Harvest Moisture Price Calculator
Once you have identified discount schedules of interest, you may uncheck those you are not interested in by clicking on the associated colors in the webtool’s legend. Next, select a range for the moisture range window. The width of this window can be adjusted based on how long you predict it will take to harvest your crop (assuming no weather/disrupting events). Now, set the upper end of the moisture range at the level where elevator discounts begin, noting the average price received. This assumes you plan on starting harvest at 15.0% moisture for corn or 13.0% moisture for soybeans. The average price received should be less than the offered price, as you expect to deliver bushels subject to implicit discounts (i.e., below the 15.0% and 13.0% moisture levels). Now, begin to move the harvest window to the right, into the area where explicit discounts begin to accumulate, tracking how average price changes along the way. From this, find the maximum average price, and then identify the harvest moisture associated with this. If everything were to work out perfectly, you would start harvest at this moisture level.
Managing harvest grain moisture level is tough line to walk. Discounts await the crop producer from either side – and while delivering all your grain at exactly 15.0% or 13.0% would be great, it is just not realistic. However, the producer has the decision-making power to reduce the amount of moisture discounts faced, potentially resulting in a large improvement to their bottom line.
We hope this article and the virtual tool provided here proves useful in the grower’s decision-making process. At the very least, we hope to challenge producers to consider the impact moisture level can have on their operation. In the end, optimizing a crop’s moisture level is only one component in generating net income, and it should be considered alongside other factors such as acres to harvest, price, basis, transportation, storage, time constraints, and harvest costs.
