2021 provided a shot of profitability for many producers across the Midwest. In Nebraska, we saw the combination of rising prices and excellent yields create the largest net farm income on record for the Nebraska Farm Business averages. This profitability led to a significant improvement in liquidity, which was needed by many farms, but now the challenge moves to protecting that liquidity.
Liquidity is traditionally measured with a Current Ratio, Working Capital, or more recently Working Capital to Gross Income. All these measures deal with Current Assets (cash and those assets that will be used or turned into cash in the next 12 months, such as prepaid expenses, grain, feed, feeder livestock, etc.) and Current Liabilities (operating notes, accounts payable, current portion of long-term loans). Working Capital measures the difference between these two numbers, or the margin that would be left over after satisfying all current liabilities. Working Capital to Gross Income is taking that first measure divided by your accrual gross income. This measures if there is enough working capital for an operation. For example, $100,000 of working capital is great for a farm whose gross income is $200,000, but it is not nearly enough for a farm whose gross income is $2 million.
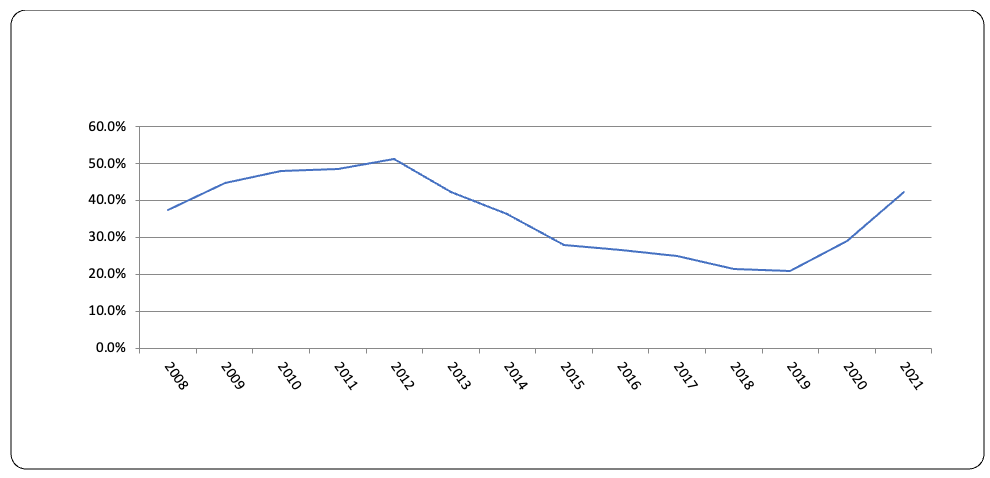
The following chart shows the trend of working capital to gross income for the past 14 years. This takes us back to the start of the last upturn in profitability in Nebraska, lasting from 2008-2012. You can see the ratio improve from just under 40% to over 50% in that time and then rapidly decline to under 30% by 2015. Profitability over the past two years has again brought the average over 40%. In general, we would like to see this number always be over 30%.
Working Capital to Gross Income Ratio - All Farms
So, what happened in 2013-2019 that “burned” liquidity that we can learn from in 2022?
Tax management strategies caused a lot of problems, and it will be extra important to handle them correctly in 2022. Many operations’ gross cash farm income is already higher than in past years. We saw the largest inventory increase on average, which means producers had more value of grain and livestock brought into 2022 than ever before. If you are one of those producers, starting your tax planning pre-harvest will be vital in making management plans. If you already have a higher gross income than usual, selling at harvest will put you in a position where you may feel you have to make extreme decisions in December to put your taxable income in a reasonable position.
Those extreme decisions may include buying equipment you do not need, prepaying expenses that may not be a good decision or even a valid prepaid expense, increasing debt to cover those purchases and other short-term solutions that cause long-term problems.
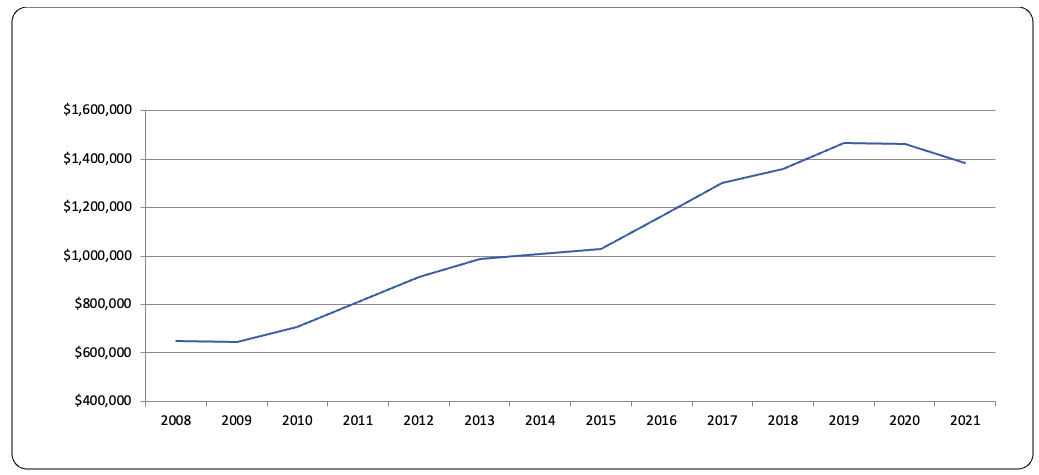
We saw many of these extreme “solutions” in 2008-2012 as profitable years kept stacking up. However, while liquidity improved, total debt skyrocketed. Many producers borrowed money to buy equipment to write off on their taxes, prepay expenses, for family living needs, and to buy land. Then when profitability decreased quickly in 2013-2015, all those payments were due, but there was no income to pay them. This is when we saw the rapid loss of liquidity. The cash reserves had to be “burned” to cover the decisions made during profitable times.
Average Farm & Non-Farm Debt - All Farms
Historically, this is a great time to recognize taxable income. Since 2018, we have had historically low tax rates and the Section 199a deduction, which allows most producers to exclude 20% of their income from taxation. While it seems counterproductive to pay income taxes to preserve liquidity, it does work in the long run. For example, if you are in the 12% tax bracket, a $100,000 capital purchase will save you approximately $27,000 in taxes. The $100,000 section 179 expense will offset $80,000 of income (since the 199a deduction would have reduced the $100,000 of income down to $80,000). That $80,000 would be subject to a 12% Federal Income Tax, a 15.3% Self-Employment Tax, and 6.68% State Income Tax.
There are many things that could make your tax return different than this, but generally speaking, this applies. If you paid $27,000 in taxes rather than buying an asset you did not need, you would have $73,000 to reduce debt or add to your cash balance. This protects liquidity more than adding debt or spending cash unnecessarily. Capital purchases that are needed for an operation to maintain assets or improve profitability have a different decision factor and can be a beneficial tax strategy, but beware of buying assets, financing them, and using rapid depreciation to accelerate the tax benefits to year one. If you take all depreciation in year one, you will have to recognize taxable income in the future to make those payments (principle is not deductible), which could put you in a tough position in the future.
To add to the challenges in 2022, the scarcity of equipment available to purchase is real. For an asset to be depreciated, it must be “ready and available for use” which means that just because you have a purchase agreement for a new tractor, it does not mean you have a deduction. The tractor must be built and ready for use before the end of your tax year.
Prepaying expenses does not impact working capital, but it will change your current ratio. For example, if you prepay $500,000 of inputs and prior to that you had $1 million of other current assets and $500,000 of current liabilities, your current ratio prior to prepaying would be 2 (Current Assets/Current Liabilities) but after prepaying it would drop to 1.5 (assuming you borrowed the money to buy the inputs). You would still have $500,000 of working capital, so depending on how you measure liquidity, it may not affect it.
This makes prepaying a good tax management strategy, but you still must follow the guidelines from the IRS (Internal Revenue Service). A qualified prepaid expense cannot be made just to avoid taxes. There must be a management purpose (such as a discount, securing availability, or locking in lower prices) to the purchase. Prepaids are also limited to 50% of your “normal” Schedule F expenses, which seemed like a crazy reach, but we had operations that needed to watch this in 2011 and 2012. Rent and feed also have some special rules, so before prepaying those, talk with your tax professional.
The challenge that comes with prepaying expenses is the “snowball” that forms. If you “steal” $100,000 of expenses from next year to deduct this year, then you will be looking to prepay not only the same $100,000 the next year but another $100,000 to keep income at the same level. It takes dramatic declines in profitability to reverse the snowball.
Protecting liquidity is going to be important over the next couple of years as input prices rise and we figure out what the new commodity price normal will be. History tells us that we will be looking at tight margins again soon, so using these years of profitability to heal up battered balance sheets may be the difference between operations that survive and those that do not.