Market Shocks
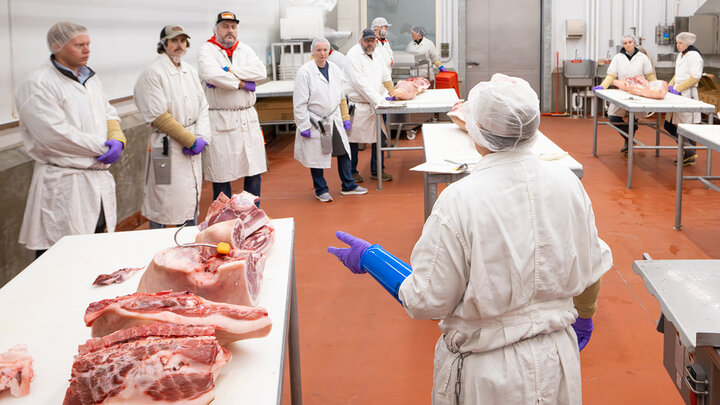
COVID-19 and its variants have had a significant impact on many sectors within the U.S. and other foreign economies. Its impacts on the livestock and poultry sector have primarily come through a reduced labor supply in meat processing plants and through short-term market disruptions as the balance of institutional and retail demand shifted. Labor has been primarily reduced through either illness or fear of illness (Polansek and Sullivan, 2020). This, combined with increased health and safety protocols recommended by CDC and OSHA, led to plants to either slow down the speed of processing or run fewer shifts per week (Parshina-Kottas et al., 2020). Some estimates have loss of production capacity during COVID-19 at upwards of 25% for beef slaughter plants, 43% for pork slaughter plants, and 15% for chicken slaughter plants (Muth and Read, 2020).
The impact of these plant slowdowns or closures is a larger than expected supply of animal and animal products at the farm level leading to lower prices at the time of sale. The magnitudes of these price changes depend on the responsiveness (elasticities) of the livestock supply and retail demand. Since both meat demand and livestock supply are quite inelastic in the short term, we expect to see relatively large changes in prices (higher retail-level, lower farm-level) given the COVID-impacted reductions in processing capacity (Balagtas and Cooper, 2021). Future market shocks that affect meat processing capacity are likely to have similar, albeit less severe, effects as those experienced during COVID-19.
Measuring Impacts
Many industry and academic reports have begun to quantify the impacts that meat processing plant closures and slowdowns had on the livestock and poultry sector. Most assessments use an expected price damage (observed price - forecasted prices pre-COVID) multiplied by the quantity of livestock or poultry that was expected to be sold during a given marketing month. One of the issues with this method is that it requires strong assumptions on prices received and quantity sold by producers. An alternative is to use actual cash receipts (i.e., price x quantity). Each year, USDA-ERS releases cash receipts by state and animal and animal products. Table 1 shows real (2022 dollars) cash receipts for different animal and animal products for 2020 and a 10-year average (2010-2019) for Nebraska. Real (2022 dollars) are used instead of nominal dollars to eliminate the effect of inflation. Cash receipts were approximately $2.064 billion dollars less in 2020 compared to the 10-year average – approximately a 15% decline. The cattle segment account for 88% of these damages and the hog industry accounted for approximately 9%. The farm chickens, trout, and the mohair industries saw an increase in cash receipts in 2020.
Government Payments
The reduction in cash receipts in 2020 was systemic throughout the United States and not unique to Nebraska. Several government programs have been developed to mitigate lower prices received by livestock and poultry producers during 2020. The primary assistance to agricultural producers for market losses due to COVID-19 came through the Coronavirus Food Assistance Program (CFAP) administered by the USDA Farm Service Agency (USDA-FSA). Data on payments received by Nebraska producers under the first and second round of CFAP are shown in Table 2. These payments helped offset the losses incurred in 2020 due to COVID-19 and were generally paid out in 2020 and early 2021, although some program sign-ups and payments have rolled into 2022. Comparing total CFAP payments to the nominal decline in cash receipts shows that the impacts were almost entirely offset. Total CFAP payments were $838,946 and the nominal decline in cash receipts during 2020 compared to the 10-year average was $835,953. The CFAP programs provided substantial assistance to Nebraska producers but are not permanently established programs to prepare for future shocks or market losses.
| Commodity | Nebraska cash receipts (Real 2022): | |||
|---|---|---|---|---|
| 10-year average (2010-2019) | 2020 | Nominal Difference (2020 - 10-yr avg.) | Percent Difference | |
| (2010-2019) | $1,000 | $1,000 | $1000 | % |
| Animals and products | 13,824,747 | 11,760,008 | -2,064,739 | -14.94 |
| Meat animals | 13,216,395 | 11,222,826 | -1,993,569 | -15.08 |
| Cattle and calves | 12,217,183 | 10,407,150 | -1,810,033 | -14.82 |
| Hogs | 999,213 | 815,675 | -183,538 | -18.37 |
| Dairy products, Milk | 287,737 | 285,332 | -2,405 | -0.84 |
| Poultry and eggs | 244,871 | 190,909 | -53,962 | -22.04 |
| Broilers | 20,899 | 17,885 | -3,014 | -14.42 |
| Chicken eggs | 211,029 | 165,415 | -45,614 | -21.61 |
| Farm chickens | 31 | 85 | 54 | 172.44 |
| Turkeys | 12,912 | 7,524 | -5,388 | -41.73 |
| Miscellaneous animals and products | 75,743 | 60,941 | -14,802 | -19.54 |
| Aquaculture | 1,511 | 3,350 | 1,839 | 121.65 |
| Trout | 1,511 | 3,350 | 1,839 | 121.65 |
| Sheep and lambs | 14,657 | |||
| Honey | 5,787 | 3,550 | -2,237 | -38.65 |
| Mohair | 35 | 39 | 5 | 13.04 |
| Other animals and products | 66,512 | 53,657 | -12,855 | -19.33 |
| All other animals and products | 66,164 | 53,657 | -12,507 | -18.90 |
| Mink pelts | 870 | |||
| Wool | 433 | 345 | -88 | -20.40 |
Source: USDA-ERS (2022) Cash Receipts Database, authors calculations
| Program | Livestock | Dairy | Eggs/Broilers | Contract Producers | Total Livestock, Dairy, and Poultry |
|---|---|---|---|---|---|
| $1,000 | $1,000 | $1,000 | $1,000 | $1,000 | |
| CFAP-1 and Top-Up Payments | $533,599 | $11,098 | -- | -- | $544,700 |
| CFAP-2 and Top-Up Payments | $284,199 | $7,414 | $141 | $2,495 | $294,250 |
| Total | $817,798 | $18,512 | $141 | $2,495 | $838,946 |
Source: USDA-FSA (2022), authors calculations
References
Balagtas, J.V. and J. Cooper. 2021. "The Impact of COVID-19 on United States Meat and Livestock Markets" Choices. Quarter 3. Accessed on February 8, 2022. Available online: https://www.choicesmagazine.org/choices-magazine/theme-articles/agricultural-market-response-to-covid-19/the-impact-of-covid-19-on-united-states-meat-and-livestock-markets
Muth, M., and Q. Read. 2020, July 7. “Effects of COVID-19 Meat and Poultry Plant Closures on the Environment and Food Security.” Insights Blog. Accessed on February 8, 2022. Available online: https://www.rti.org/insights/covid-19-effect-meat-supply-chain
Parshina-Kottas, Y., L. Buchanan, A. Aufrichtig, and M. Corkey. 2020, June 12. “Take a Look at How COVID-19 Is Changing Meatpacking Plants.” Chicago Tribune. Accessed on February 8, 2022. Available online: https://www.chicagotribune.com/coronavirus/sns-nyt-how-coronavirus-changing-meatpacking-plants-20200612-xxmpecs3ebhppafujpj5wzmw6u-story.html.
Polansek, T., and A. Sullivan. 2020, June 15. “Meatpacking Workers Often Absent after Trump Order to Reopen.” Reuters. Accessed on February 8, 2022. Available online: https://www.reuters.com/article/us-health-coronavirus-usa-meatpacking/meatpackingworkers-often-absent-after-trump-order-to-reopen-idUSKBN23M1EQ.
USDA Economic Research Service. 2022. “Nebraska Cash Receipts”. Accessed in February 2022. Available online: https://www.ers.usda.gov/data-products/farm-income-and-wealth-statistics/data-files-u-s-and-state-level-farm-income-and-wealth-statistics/
USDA Farm Service Agency. 2022. “Coronavirus Food Assistance Program 1 Data.” Accessed on February 8, 2022. Available online: https://www.farmers.gov/coronavirus/pandemic-assistance/cfap1/data
USDA Farm Service Agency. 2022. “Coronavirus Food Assistance Program 2 Data.” Accessed on February 8, 2022. Available online: https://www.farmers.gov/coronavirus/pandemic-assistance/cfap2/data
Elliott Dennis is an assistant professor of livestock marketing risk management, and Brad Lubben is an associate extension professor and agricultural policy specialist. Both are in the Department of Agricultural Economics at the University of Nebraska-Lincoln.


