This article was first published by Pork Talk magazine
There is strong local and national interest in adding hog barns to existing row crop operations. Declining on farm income over the past several years has accelerated this interest. Grain operations cite diversifying farm income, adding another family to the farm operation, and/or replace commercial fertilizer expense as the primary reasons for adding a hog barn.
While there is industry demand to increase hog contract growing, these agreements can possess significant benefits and risks to producers. This is the first of a four-part series, which will discuss some financial and legal implications of adding a hog barn to an existing grain operation. In this first part, I discuss how the type of hog operations in the US have changed over time, where hogs are raised in Nebraska, and how Nebraska compares to other states.
Types of Hog Operations that Exist in United States
Pigs can be grown by three different types of producers – independent, contract grower (contractee), and contractor/integrator. An independent grower owns the pigs, buildings, equipment and be responsible for all costs, production risks, and receive the full market price for the hogs. Market price comes in the form of negotiated cash (spot), formula, other market formula, swine or pork market formula, or other purchase agreement. A contract grower (contractee) owns all the facilities (i.e. land, builds, and maintain buildings, equipment, etc.) and is responsible for all its operating costs (i.e. utilities, supplies, labor, repairs etc.). They do not physically own the pigs but are hired, or hire someone, to feed and care for the pigs. The contractee is then paid by a contractor/integrator on either a per head or per pig space contract. The contractor or integrator is the person who owns the pigs, purchases and delivers all the feed, provides technical health and nutrition consultation, and ultimately markets finished pigs. They often own several stages of production up to and including packing plants.
Table 1 summarizes U.S. Agriculture Census hog inventories and number of operations data for the entire U.S. by type of hog operation from 2002 to 2017. Overall, inventories are climbing in the aggregate. There is a shift away from independent production and more towards contract growing and contractor raised. From 2002 to 2017, contract growers rose from 34% to 44% of total inventories while independent growers declined from 51% to 35%. The number of operations required to meet the growing inventories levels has decreased implying that existing operations have increased capacity. There were 58,180 independent growers in 2017 and 70,321 in 2002. The number of contract growing operations decreased from 8,805 in 2002 to 7,672 in 2017. Likewise, the number of contractors fell sharply from 884 in 2002 to 587 in 2017. While the number of operations has fallen across all types of hog operations, the relative share of each operations to the total number of operations has remained constant – 88%, 11%, and 1% for independent, contract, and contractor respectively.
Locations of Hog Operations in Nebraska
So how has hog production in Nebraska compare to other states and how has it changed over time? The number of hogs grown under contract in Nebraska is relatively small compared to other states. According to the U.S. Agriculture Census (2017), the number of hogs grown under contract in Nebraska is about 5% of Iowa’s inventory, 14% of Minnesota’s, and 39% of Missouri’s. These percentages have remained relatively stable from 2002 to 2017 making Nebraska the 9th largest state for hogs grown under contract. While hog inventories have remained relatively stable, the number of operations required to raise these hogs under contract has declined. In 2002, 353 operations raised hogs under contract compared to 197 in 2017. Figures 1-4 plot the number of operations and the hog inventories for 2002 and 2017 respectively. Both the number of hogs and operations are clustered in the North East corner of the state near the Iowa and South Dakota border. Missing data implies either no operations reported or that the county did not meet confidentiality requirements for public reporting. Clearly the number of operations in Nebraska has decreased while the total number of hogs raised has increased.
Market Implications for Nebraska
Nebraska is widely considered by many in the hog industry as the next viable location for hog contract barn production. Industry leaders cite a changing political landscape, shorter shipping distance to export markets, increased biosecurity, and feed grain availability as the key factors influencing companies desire to increase hog barn production. These claims have some merit. The repeal of the corporate farming law in 2007 (originally put in place in 1982) made it possible for corporations to enter and growing protein demand in Asia has spurred on production closer the West and Pacific Northwest. Growing concern over PERS, ASF, and other foreign animal disease outbreaks have elevated the concern of biosecurity issue and densely populated areas allow diseases to spread rapidly. All of this coupled with a large local supply of corn and soybeans has Nebraska potentially poised to expand hog production by effectively lowering production costs.
| - | 2002 | - | 2007 | - | 2012 | - | 2017 | - |
|---|---|---|---|---|---|---|---|---|
| Value | Pct.a | Value | Pct. | Value | Pct. | Value | Pct. | |
| Inventoryb | ||||||||
| Independent | 31,198 | 51% | 31,008 | 48% | 31,460 | 50% | 24,485 | 35% |
| Contract Grower | 21,075 | 34% | 25,681 | 40% | 26,545 | 42% | 30,894 | 44% |
| Contractor/Integrator | 9,265 | 15% | 7,824 | 12% | 5,345 | 8% | 15,040 | 21% |
| Total | 61,538 | 64,513 | 63,349 | 70,418 | ||||
| Operations | ||||||||
| Independent | 70321 | 88% | 66267 | 88% | 55566 | 88% | 58180 | 88% |
| Contract Grower | 8805 | 11% | 8463 | 11% | 7122 | 11% | 7672 | 12% |
| Contractor/Integrator | 884 | 1% | 712 | 1% | 558 | 1% | 587 | 1% |
| Total | 80,010 | 75,442 | 63,246 | 66,439 |
Notes: aPercent of total value within a given year; bInventories measured in 1,000’s
Source: U.S. Agriculture Census (2002, 2007, 2012, 2017)
Figure 1. Number of Hog Operations in Nebraska by County in 2002
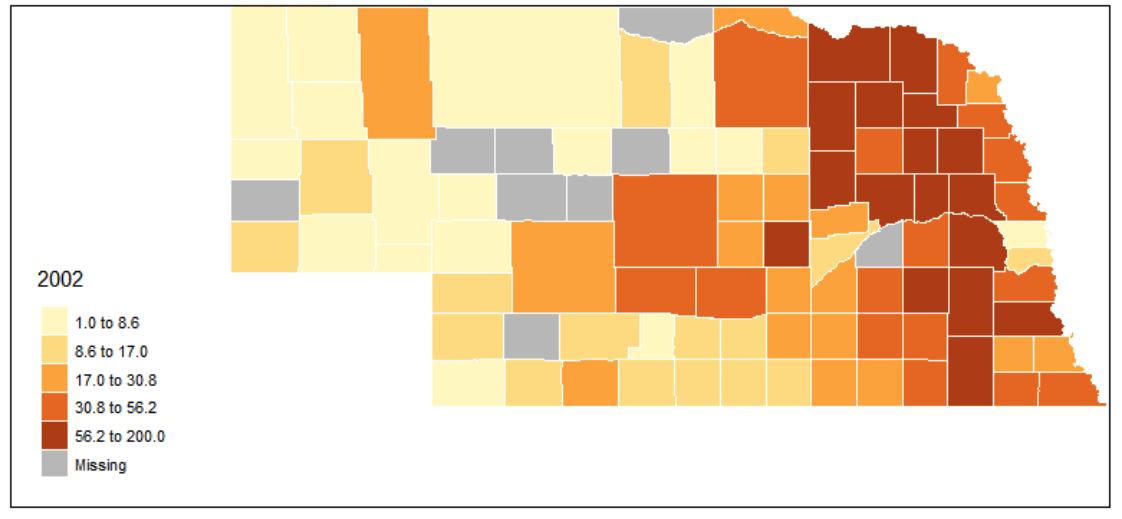
Data Source: USDA-NASS (2020))
Figure 2. Number of Hog Operations in Nebraska by County in 2017
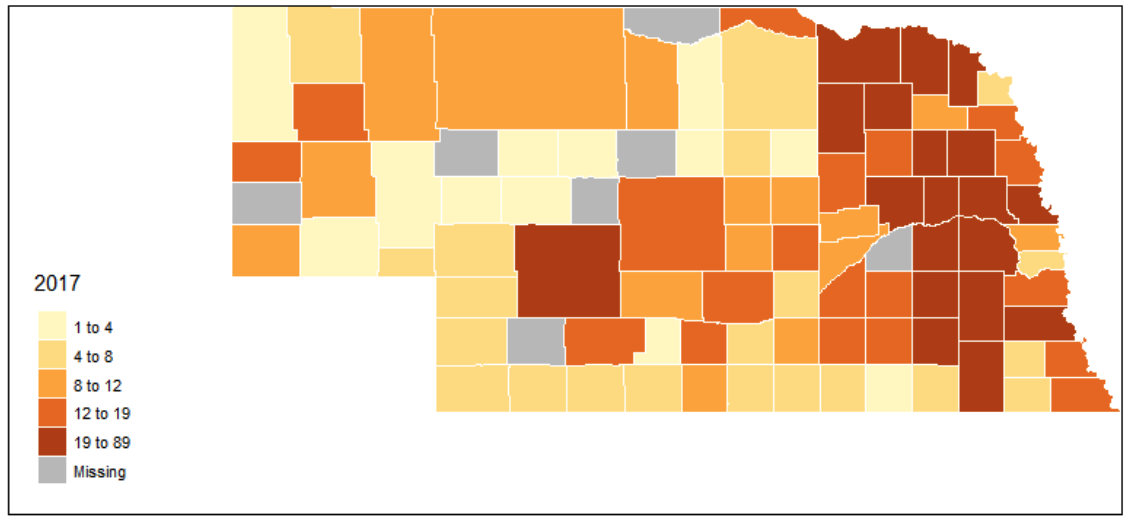
Data Source: USDA-NASS (2020))
Figure 3. Hog Inventory in Nebraska by County in 2002
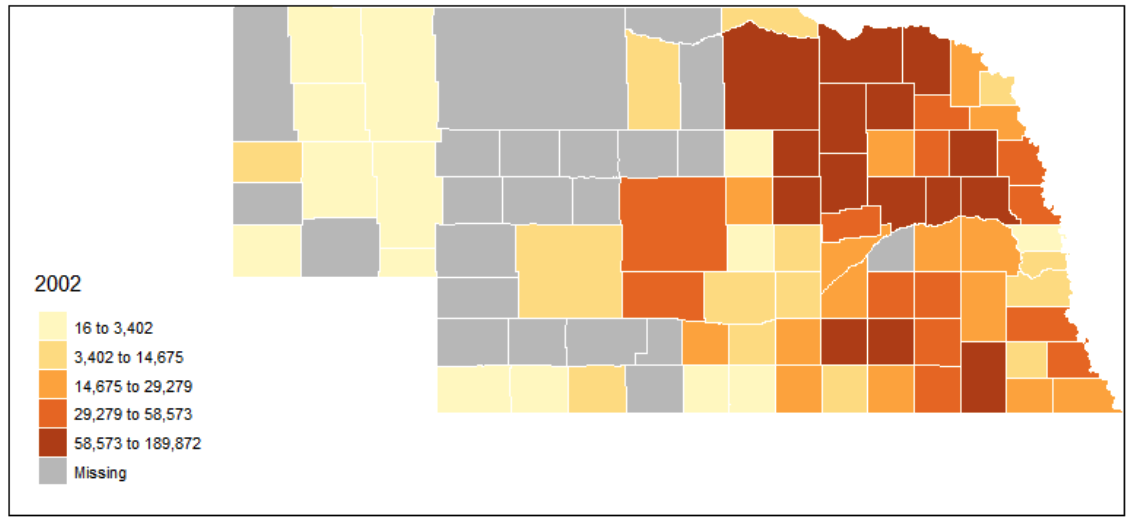
Data Source: USDA-NASS (2020))
Figure 4. Hog Inventory in Nebraska by County in 2017
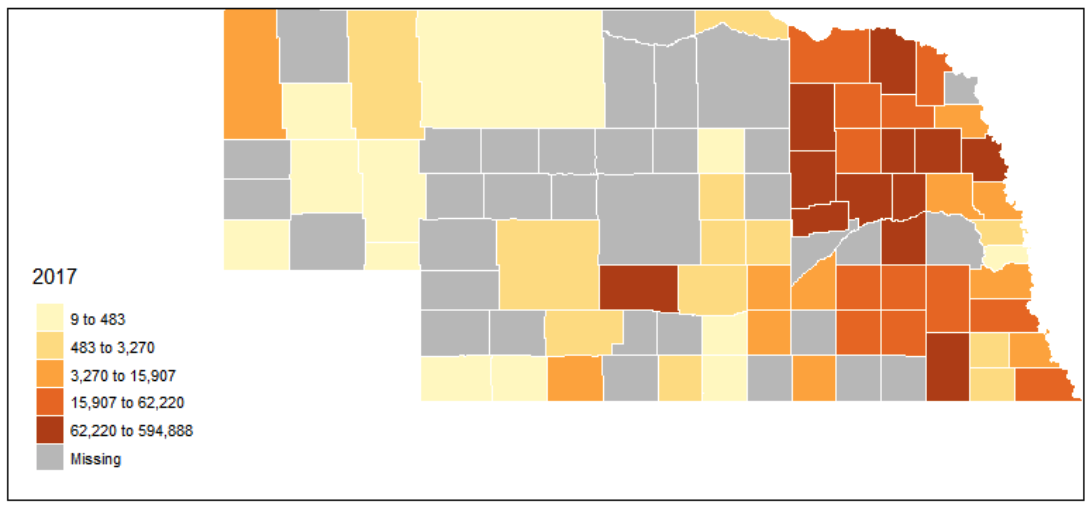
Data Source: USDA-NASS (2020))