In the Upper Midwest and Great Plains region of the United States, agriculture is a fundamental driver of the economy and a primary steward of the landscape. The seven-state region of Iowa, Kansas, Minnesota, Missouri, Nebraska, North Dakota, and South Dakota represents a dominant part of the nation’s agricultural sector, producing more than 30% of the nation’s economic output from agriculture in 2021 (USDA Economic Research Service). The region occupies more than 40% of the nation’s cropland and nearly 20% of the nation’s pastureland as of the 2017 Ag Census (USDA National Agricultural Statistics Service).
Even among this vibrant agricultural region, Nebraska is a leader in terms of the impact, significance, and output of the ag sector. The following tables provide some statistical perspectives of Nebraska agriculture in relation to the seven-state region and to the United States as a whole.
| - | Nebraska | Region Total | United States |
|---|---|---|---|
| Value of Agricultural Sector Production | |||
| $1,000 | $28,753,747 | $152,891,454 | $487,225,544 |
| % of U.S. Total | 5.90% | 31.38% | - |
| U.S. Rank | 4 | - | - |
| - | |||
| Net Value Added | |||
| $1,000 | $11,497,146 | $63,417,512 | $209,306,242 |
| % of U.S. Total | 5.49% | 30.30% | - |
| U.S. Rank | 4 | - | - |
| - | |||
| Net Farm Income | |||
| $1,000 | $8,037,344 | $43,279,831 | $140,980,917 |
| % of U.S. Total | 5.70% | 30.75% | - |
| U.S. Rank | 5 | - | - |
Source: USDA Economic Research Service (ERS)
Nebraska contributes more than 5% to the nation’s agricultural sector, whether calculated in value of ag production, net value added (economic contribution to the nation’s gross domestic product or GDP), or net farm income (after factors of production like land, labor, and capital are compensated). Related data from the U.S. Department of Commerce Bureau of Economic Analysis shows further evidence of the importance of Nebraska agriculture. The production ag sector contributes more than 6.5% of the state’s gross state product (the state equivalent to GDP at the national level), the second-highest share in the country behind only North Dakota, where ag is a larger share of a smaller state economy.
| - | Nebraska | Region Total | United States |
|---|---|---|---|
| Number of Operations | 46,332 | 411,479 | 2,041,220 |
| % of U.S. Total | 2.27% | 20.15% | - |
| U.S. Rank | 18 | - | - |
| - | |||
| Number of Producers | 77,097 | 680,188 | 3,399,834 |
| % of U.S. Total | 2.27% | 20.01% | - |
| U.S. Rank | 17 | - | - |
| - | |||
| Total Land Area | |||
| Acres | 49,163,591 | 324,872,471 | 2,260,681,965 |
| % of U.S. Total | 2.17% | 14.37% | - |
| U.S. Rank | 15 | - | - |
| - | |||
| Total Ag Land | |||
| Acres | 44,626,564 | 254,843,882 | 910,132,297 |
| % of U.S. Total | 4.90% | 28.00% | - |
| U.S. Rank | 4 | - | - |
| - | |||
| Ag Land % of Total State Land Area | 90.77% | 78.44% | 40.26% |
| U.S. Rank | 1 | - | - |
| - | |||
| Cropland Acres | 22,242,599 | 163,065,459 | 396,433,817 |
| % of U.S. Total | 5.61% | 41.13% | - |
| U.S. Rank | 6 | - | - |
| - | |||
| Pastureland Acres | 22,031,430 | 83,726,224 | 440,606,426 |
| % of U.S. Total | 5.00% | 19.00% | - |
| U.S. Rank | 8 | - | - |
| - | |||
| Woodland Acres | 352,535 | 8,052,199 | 73,092,054 |
| % of U.S. Total | 0.48% | 11.02% | - |
| U.S. Rank | 37 | - | - |
Source: USDA National Agricultural Statistics Service
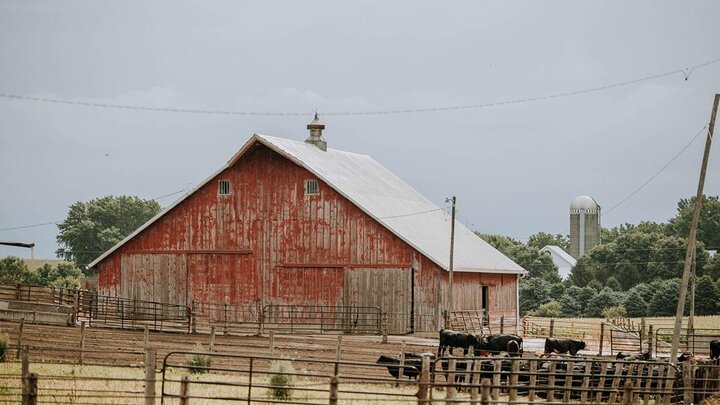
According to U.S. Census of Agriculture data from 2017, there were 46,332 farm operations in the state of Nebraska with 77,097 producers. These operations worked over 2% of the nation’s total landscape, or nearly 5% of the nation’s total agricultural land, ranking them 4th nationally.
| - | Nebraska | Region Total | United States |
|---|---|---|---|
| Corn, Grain - Production, Measured in BU | 1,854,640,000 | 8,193,560,000 | 15,073,820,000 |
| % of U.S. Total | 12.30% | 54.36% | - |
| U.S. Rank | 3 | - | - |
| - | |||
| Soybeans - Production, Measured in BU | 350,910,000 | 2,205,070,000 | 4,465,382,000 |
| % of U.S. Total | 7.86% | 49.38% | - |
| U.S. Rank | 4 | - | - |
| - | |||
| Wheat - Production, Measured in BU | 41,160,000 | 732,685,000 | 1,646,254,000 |
| % of U.S. Total | 2.50% | 44.51% | - |
| U.S. Rank | 14 | - | - |
Source: USDA National Agricultural Statistics Service
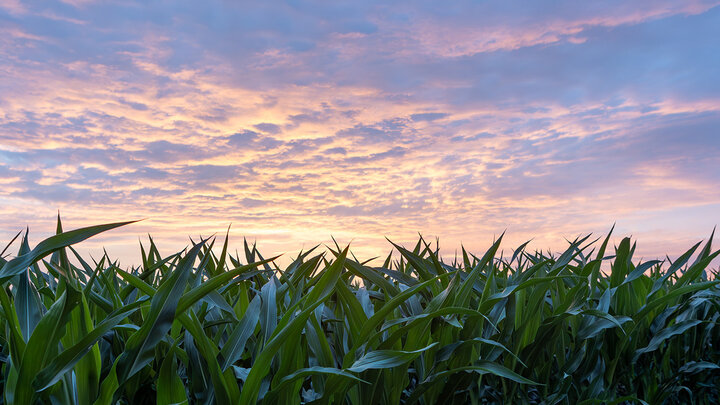
Not surprisingly, the Cornhusker State is a leader in corn production, ranking 3rd nationwide. Nebraska is also in the top 5 for soybean production and is in the top 15 for wheat production. While smaller crops nationally, Nebraska is also a leading state for grain sorghum, sugar beets, and dry beans, among other crops.
| - | Nebraska | Region Total | United States |
|---|---|---|---|
| Cattle, Incl Calves - Production, Measured in Lb. | 5,818,846,000 | 17,913,580,000 | 45,935,139,000 |
| % of U.S. Total | 12.67% | 39.00% | - |
| U.S. Rank | 2- | - | - |
| - | |||
| Cattle, Incl Calves Inventory | 6,850,000 | 29,510,000 | 93,789,500 |
| % of U.S. Total | 7.30% | 31.46% | - |
| U.S. Rank | 2 | - | - |
| - | |||
| Cattle, Cows, Beef Inventory | 1,880,000 | 9,331,000 | 30,843,600 |
| % of U.S. Total | 6.10% | 30.25% | - |
| U.S. Rank | 4 | - | - |
| - | |||
| Cattle, On Feed Inventory | 2,700,000 | 7,539,000 | 14,667,400 |
| % of U.S. Total | 18.41% | 51.40% | - |
| U.S. Rank | 3 | - | - |
| - | |||
| Hogs - Production, Measured in Lb. | 1,549,277,000 | 23,346,165,000 | 39,972,892,000 |
| % of U.S. Total | 3.88% | 58.40% | - |
| U.S. Rank | 7 | - | - |
| - | |||
| Hogs - Inventory | 3,650,000 | 44,048,000 | 74,446,100 |
| % of U.S. Total | 4.90% | 59.17% | - |
| U.S. Rank | 6 | - | - |
| - | |||
| Red Meat, Slaughter, Commercial - Production, Measured in Lb. | 7,968,400,000 | 29,459,500,000 | 55,813,500,000 |
| % of U.S. Total | 14.28% | 52.78% | - |
| U.S. Rank | 2 | - | - |
Source: USDA National Agricultural Statistics Service
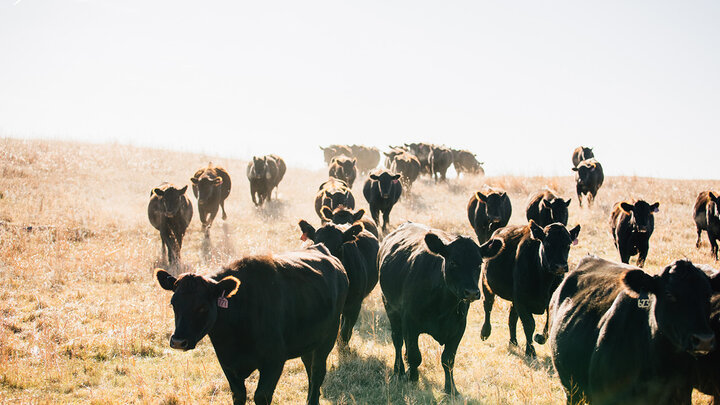
The livestock and red meat production numbers show Nebraska near the top as well. Nebraska ranks 2nd in cattle production and is a leading state in all inventory numbers. Nebraska also ranks in the top 10 nationally in hog production. Total red meat production from the livestock sector amounts to nearly 8 billion pounds, more than 14% of national production, ranking 2nd nationally.
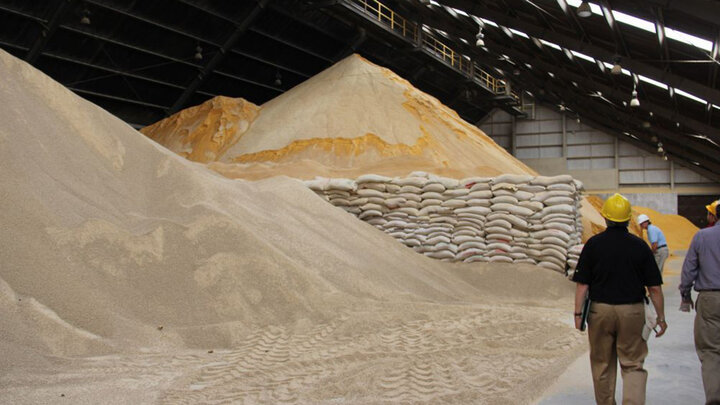
While this data confirms the economic significance of farm and ranch production in the state, the economic impact of the sector stretches far beyond the farm gate, both backwards for inputs such as farm supplies and ag equipment manufacturing as well as forwards for ag processing, merchandising, and food manufacturing. Previous research by Thompson, Lubben, and Stokes (2020) showed the broader Nebraska agricultural production complex accounts for more than 33% of the total value of state output and more than 20% of the total economic value added in the state when direct and indirect economic impacts are considered.
References
Economic Research Service. n.d. Value Added Years by State. United States Department of Agriculture. Accessed December 19, 2022. https://data.ers.usda.gov/reports.aspx?ID=17830#P230416b784754f068b20d6….
National Agricultural Statistics Service. n.d. Quick Stats. United States Department of Agriculture. Accessed December 19, 2022. https://quickstats.nass.usda.gov/.
Thompson, E., B. Lubben, and J. Stokes. 2020. “The 2017 Economic Impact of the Nebraska Agricultural Production Complex.” Department of Agricultural Economics and Bureau of Business Research, University of Nebraska-Lincoln, Lincoln: Bureau of Business Research Publications. Accessed December 19, 2022. doi:10.32873/dc.unl.oth008.
Tatum Brunkow is a Graduate Research Assistant in the Department of Agricultural Economics at the University of Nebraska-Lincoln. Brad Lubben is an Associate Professor and Extension Policy Specialist in the Department of Agricultural Economics at the University of Nebraska-Lincoln.