This article was first published as part of the UNL Deparment of Agricultural Economics series, "Cornhusker Economics," on May 21, 2025.
Each year, Nebraska Farm Business, Inc. (NFBI), compiles and analyzes real financial data from farms and ranches across the state to provide insight into the financial health of Nebraska agriculture. As an organization dedicated to helping producers remain profitable through financial analysis and benchmarking, NFBI’s data reflects the actual performance of participating operations and serves as a valuable resource for understanding industry trends. This article highlights key findings from the 2024 data set. A complete and detailed report will be available for purchase soon at www.nfbi.net under the Annual Reports section.
Net Income Recovery Falls Short of Historical Highs
Net farm income nearly doubled in 2024, rising to $85,471 from $38,005 in 2023. While this marks a notable recovery, it remains significantly below the peak of $504,052 reached in 2021. This sharp contrast highlights the volatility producers have experienced in recent years, driven by market fluctuations, weather variability, and shifting input costs.
Household Spending Steady Amid Income Fluctuations
Despite swings in income, Nebraska farm families maintained consistent household spending. Average family living expenses remained around $112,000, reflecting a disciplined approach to personal expenditures even as business income fluctuated.
Rising Debt and Shifting Balance Sheets
Farm debt continues its upward trajectory. Total farm liabilities climbed by 15% in 2024, increasing from $1.50 million to $1.71 million. Notably, current liabilities — those due within 12 months — jumped from $639,955 to $776,576, a clear sign of increased reliance on short-term financing.
Alarmingly, total farm liabilities now equal gross accrual farm revenue. This is a significant shift from 10 years ago when liabilities were only 83% of accrual income, indicating a troubling trend in balance sheet pressure and the growing role of debt in farm operations.
Liquidity Pressures Worsen
Liquidity — farms’ ability to meet short-term obligations — is deteriorating. The working capital to gross income ratio fell from 42.4% to 32% in 2024. While this remains above the low points of 21% recorded in 2018 and 2019, it represents the steepest single-year decline since record-keeping began. The only comparable drop occurred between 2013 and 2014.
This trend raises red flags, particularly given the sharp increase in current liabilities and the potential for tightening credit conditions in the future.
Interest Costs Add to Financial Strain
Rising interest rates have amplified the impact of higher debt levels. Average interest costs increased by $15,247 in 2024 compared to 2023, with a decade-long increase of $42,746. For producers of irrigated corn, this translated to an increase of $12.63 per acre over 2023 in operating interest alone — tightening already slim profit margins.
Capital Purchases Shift: Less Equipment, More Land
The average farm showed a decline in equipment purchases from 2023, suggesting caution in capital spending. However, land acquisitions increased, indicating strategic long-term investment despite tighter cash flow. This also reflects increased movement of land in the market, signaling more buying and selling activity as producers adjust their operations or seize rare opportunities to expand acreage.
Crop Enterprise Analysis: Losses Mount Despite Input Savings
Corn and soybean enterprises both struggled in 2024.
- Irrigated Corn: Gross revenue fell by $94.44 per acre due to slightly lower yields, modestly reduced market prices, and higher hedging losses. Input savings, particularly in fertilizer (down $45.37 per acre), softened the blow. Despite these savings and the ECAP payment received in 2025 for the 2024 crop (recorded as a government accounts receivable), net losses still increased by $24.29 per acre over the prior year.
- Soybeans: The outlook was more concerning. Gross revenue dropped $152.83 per acre, driven largely by weaker commodity prices, despite a 5+ bushel per acre yield increase. A $40.46 per acre reduction in costs, again largely due to fertilizer, and the ECAP payment helped, but average per-acre losses still worsened by $79.20.
Livestock Sector Offers a Brighter Outlook
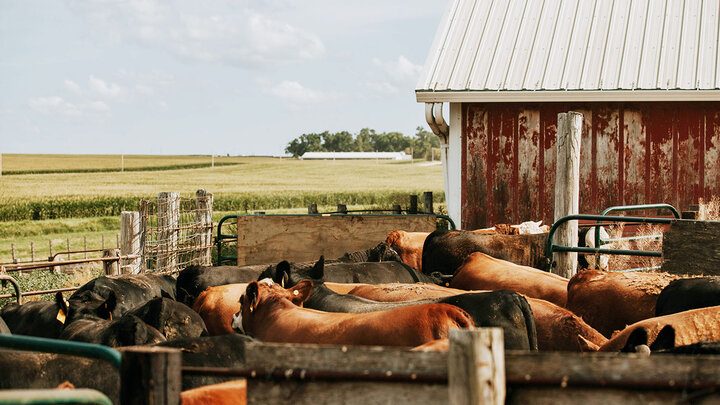
Cattle production stood out as the lone bright spot. Net returns per cow averaged $588.96. While down from 2023 due to the rising cost of breeding stock, this sector continues to show resilience and profitability, offering some stability in an otherwise mixed year.
