Survey findings from the USDA-National Agricultural Statistics Service (USDA-NASS) estimated that the value of Nebraska farm real estate, which includes all agricultural land and buildings, increased by 6.8% in 2024, to an average of $4,080 per acre (Figure 1). The year-over-year changes reflect an increase of $260 for this annual period (USDA-NASS 2024a). Florida and Tennessee lead the nation with the highest growth rates in farmland market value at 13.4% and 10.7%, with average market values of $8,300 and $5,710 per acre, respectively. Nebraska ranks 13th for the percentage increase in farm real estate compared to other states in 2024.
Figure 1. 2024 Farm Real Estate Value by State
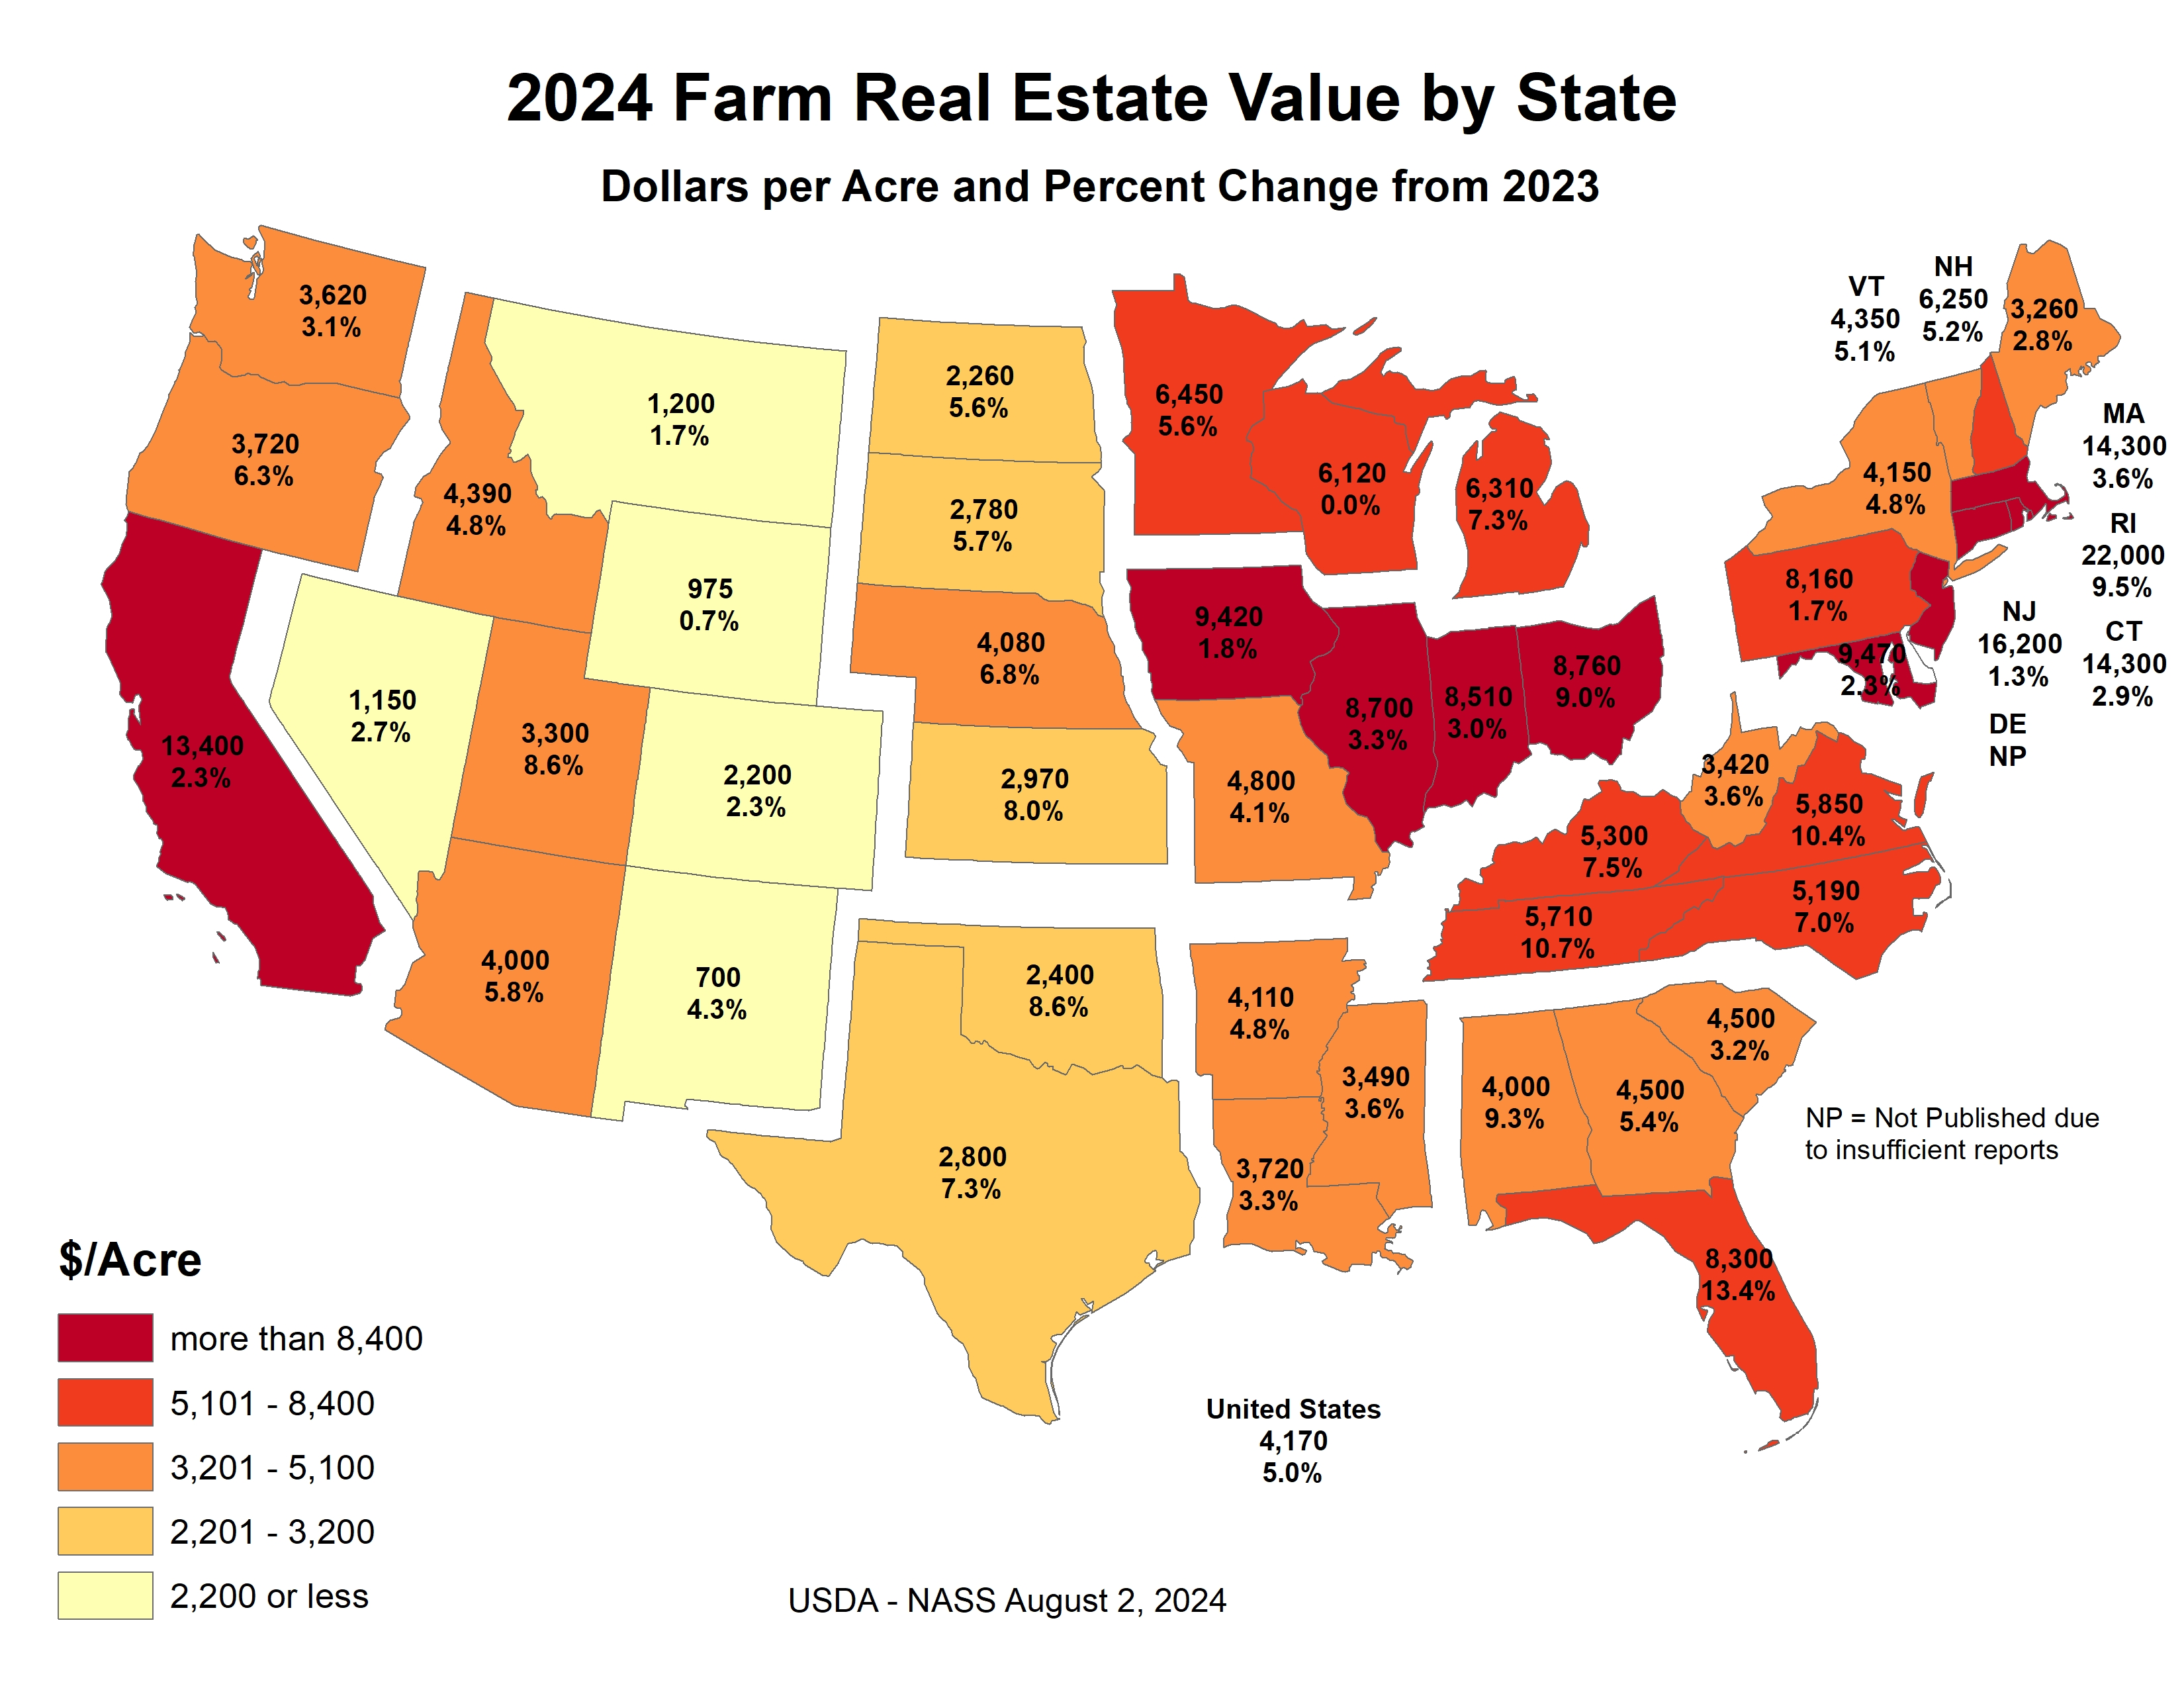
Source: Land Values 2024 Summary; USDA-National Agricultural Statistics Service, August 2, 2024.
Cropland values in Nebraska reported an increase of 6.3% to an average of $6,540 per acre. Tennessee topped the nation with an increase of 10.9%, reaching a new average of $5,610 per acre. Ohio ranked second with an annual rise of 9.7%, reaching an average of $9,270 per acre (USDA-NASS 2024a). Demand for cropland remained steady but had slowed due to moderating commodity prices and increasing production costs. Monetary policies kept the cost of financing land purchases high during 2024 as the Federal Reserve maintained measures to combat inflationary pressures. High interest rates and expenses for specific inputs, coupled with moderating commodity prices, may negatively impact future cropland values unless offset by rising farm profitability.
In 2024, higher cattle prices raised the value of pasture more than that of cropland throughout Nebraska. Year-over-year pasture gained 7.7% to a new average of $1,400 per acre in Nebraska. Cattle prices increased due to strong demand and lower livestock inventories across the United States. Hay prices generally trended lower across the state as adequate precipitation in major hay-producing regions led to good forage production. Higher cattle prices and reduced feed costs improved the financial outlook for many livestock producers. Concerns persist about sufficient rainfall for pastures and the economic impact this may have on producers.
The USDA-National Agricultural Statistics Service also reported county-level cash rent estimates for the 2024 growing season in Nebraska (USDA-NASS 2024b). These estimates provide cash rent averages for both non-irrigated and irrigated cropland, as well as pasture, on a per-acre basis (USDA-NASS 2024c). Variations in non-irrigated cropland rental rates across Nebraska are due to differences in soil type, rainfall, yield expectations, and the overall market competitiveness among different counties (Figure 2). Counties denoted in white lacked sufficient survey responses to estimate a rate or were in state regions with a low incidence of a specific production practice.
Figure 2. 2024 Non-Irrigated Cropland Cash Rent in Nebraska
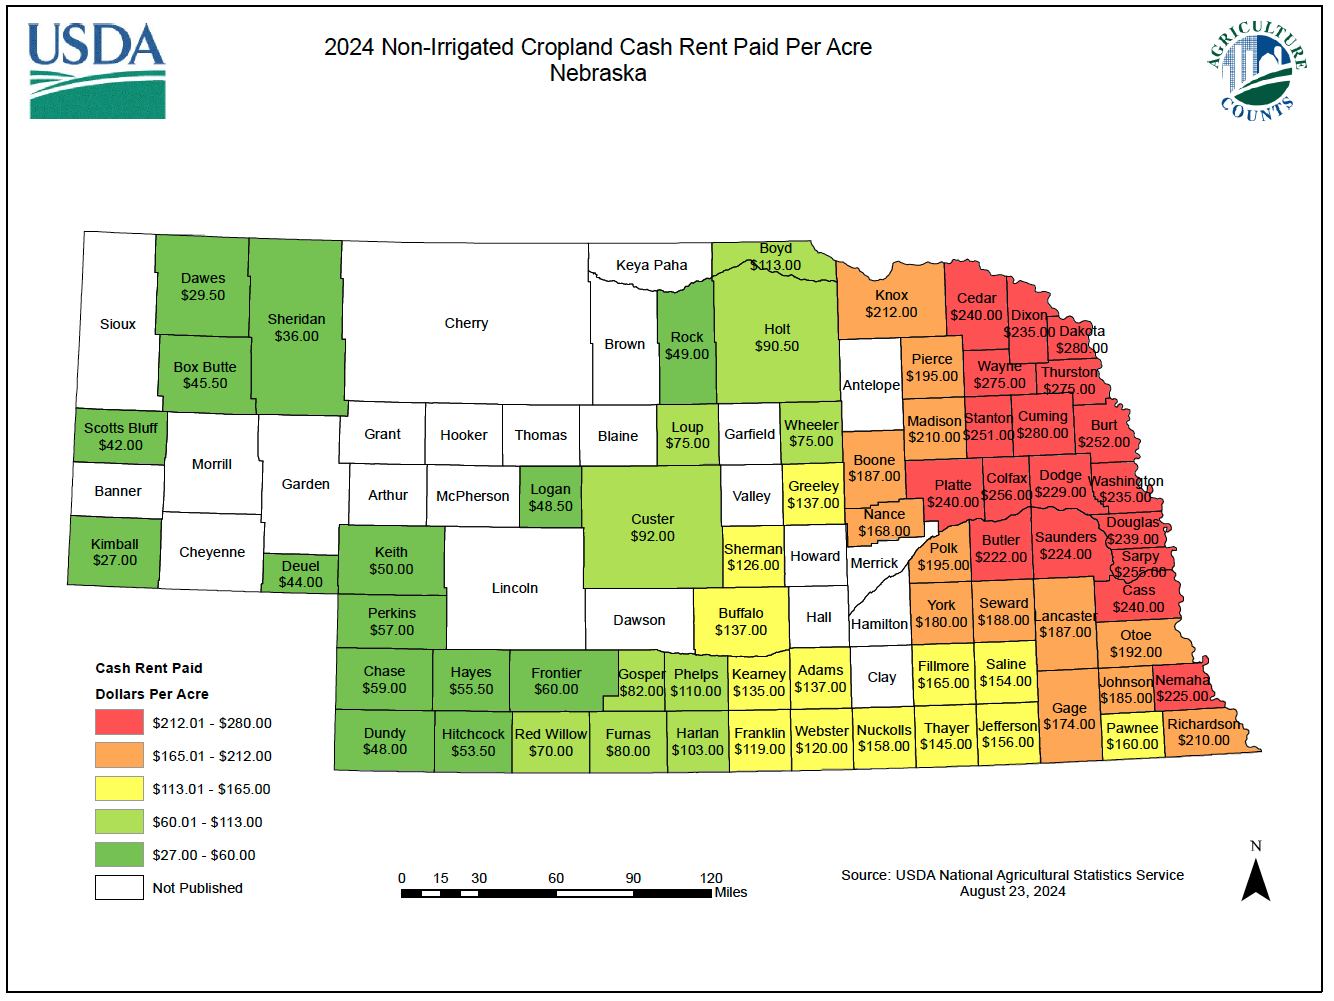
Source: 2024 Nebraska Cash Rents by County; USDA-National Agricultural Statistics Service, August 23, 2024.
Trends in irrigated cash rental rates for 2024 reflect those of non-irrigated cropland (Figure 3). Areas with low response rates to the cash rent survey or few irrigated acres did not report rates. The reported irrigated cash rental rates do not differentiate between center pivot, gravity, or flood irrigated acres. The average reflects a weighted calculation of the county's center pivot, gravity, and flood irrigation methods. Additionally, the reported rates assume that the landlord owns the entire irrigation system on the leased property. Rates may be adjusted if the tenant provides the pivot, power unit, or other irrigation system components.
Figure 3. 2024 Irrigated Cropland Cash Rent in Nebraska
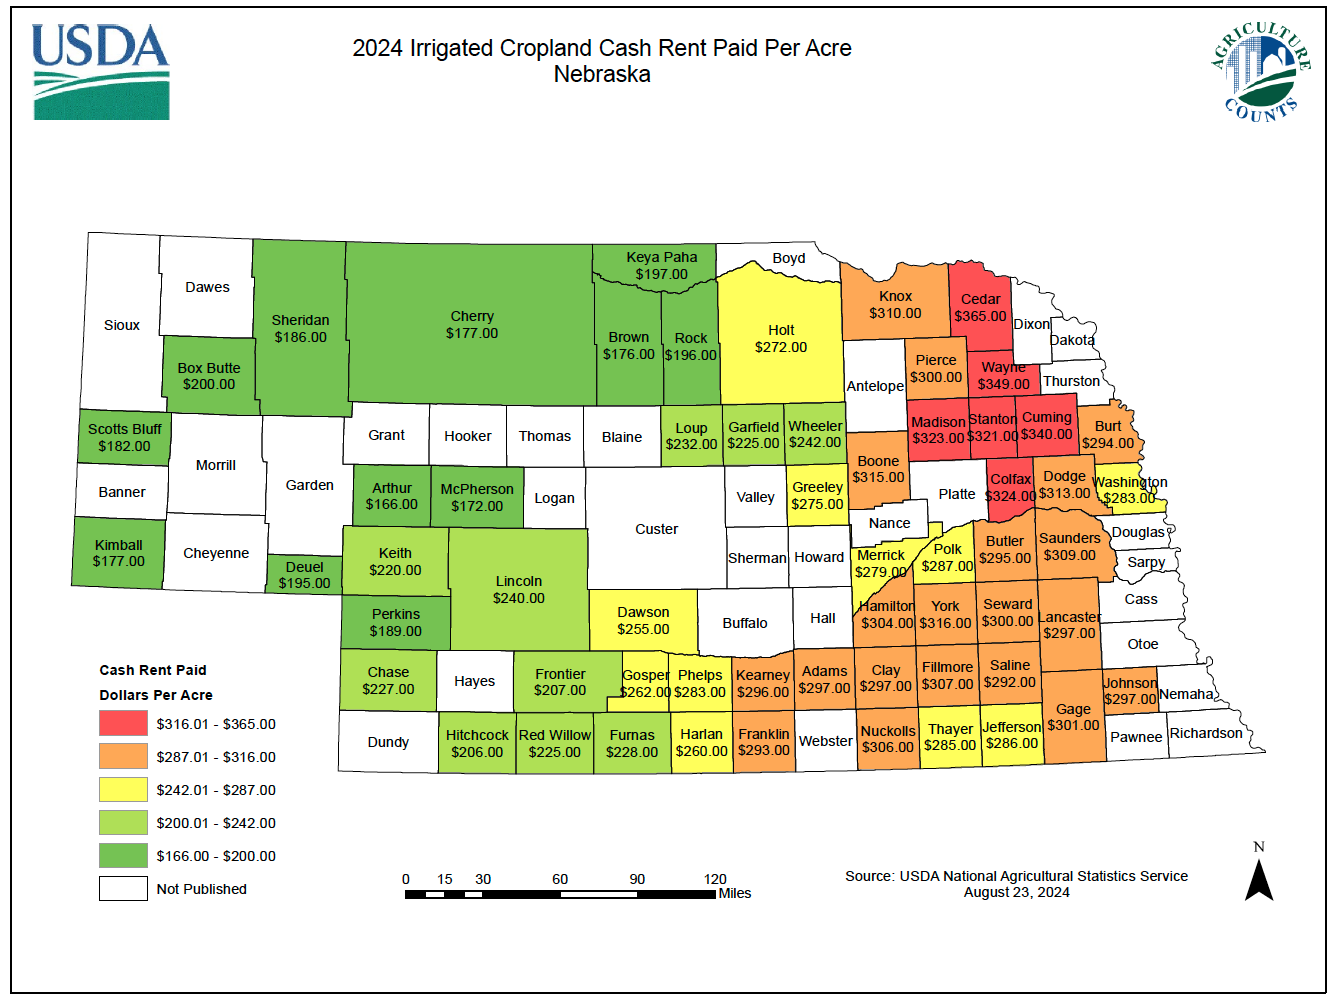
Source: 2024 Nebraska Cash Rents by County; USDA-National Agricultural Statistics Service, August 23, 2024.
Nebraska's pasture land rental rates reflect differences in stocking rates, productivity, and market competitiveness (Figure 4). The reported rates indicate the amounts paid during the summer months. Off-season grazing rental rates may be adjusted based on forage dormancy, quality, or other property features in the fall, winter, or spring calving season. This off-season period can also be influenced by winter snowfall or other weather conditions. Areas with limited pasture acres or low response rates to the cash rent survey did not report county rates.
Figure 4. 2024 Pasture Cash Rent in Nebraska
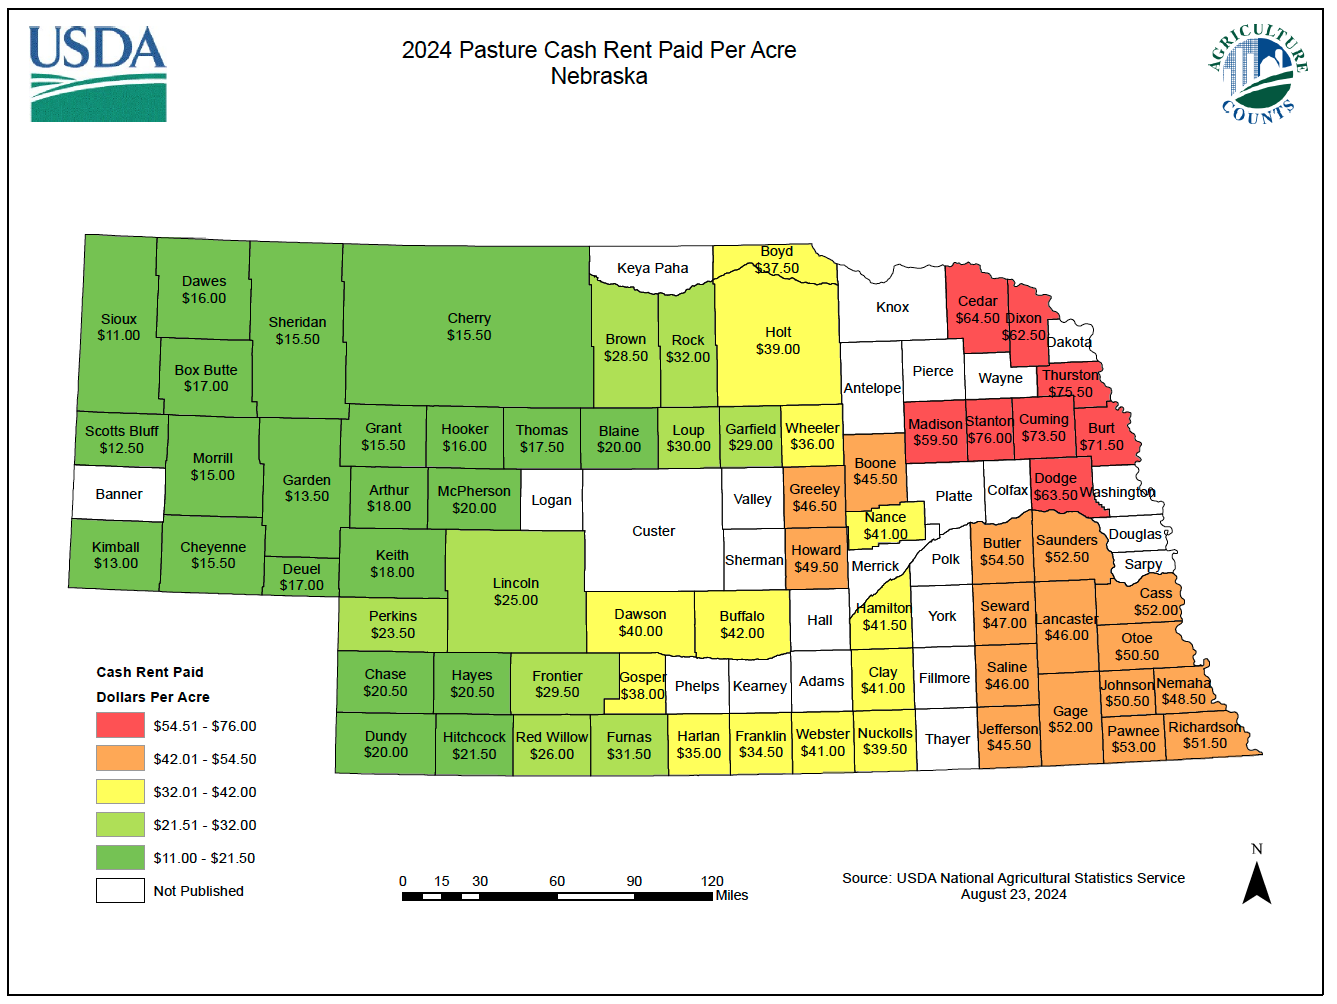
Source: 2024 Nebraska Cash Rents by County; USDA-National Agricultural Statistics Service, August 23, 2024.
Additional details on the USDA-National Agricultural Statistics Service land values and cash rental publications may be found in the reference section of this article.
Listen: Nebraska FARMcast
With Jim Jansen, Agricultural Economist, University of Nebraska-Lincoln
References
USDA-National Agricultural Statistics Service. (2024, August 2). Land Values 2024 Summary. Retrieved January 20, 2025, from: https://usda.library.cornell.edu/concern/publications/pn89d6567.
USDA-National Agricultural Statistics Service. (2024, August 24). 2024 Nebraska Cash Rents by County. Retrieved January 23, 2025, from: https://www.nass.usda.gov/Statistics_by_State/Nebraska/Publications/County_Estimates/.
USDA-National Agricultural Statistics Service. (2024, April 4). Land Values 2024 Summary. Retrieved January 29, 2025, from: https://www.nass.usda.gov/Surveys/Guide_to_NASS_Surveys/Cash_Rents_by_County/.
