The Growing Climate Solutions Act of 2021, among other things, authorizes the secretary of agriculture to develop a program that facilitates farmers, ranchers and private forest landowners in participating in a voluntary environmental credit market, including land or soil carbon sequestration. One of the conditions that needs to be watched carefully as the act is further defined and, perhaps, implemented, is the concept of additionality. Additionality may require the farmer or rancher to do something different to contribute to climate solutions. Doing something different is the key phrase. It could mean doing something in addition to what is currently being done on the farm or ranch, or it could be doing something that is atypical of common practices in the area (Plastina and Wongpiyabovorn, 2021). To some, it does not seem fair to exclude a producer from benefiting from voluntary environmental credit markets because they have been practicing environmentally sound practices for several years. However, total exclusion is unlikely in voluntary carbon credit markets, but is more likely in regulatory compliance carbon credit markets.
Using data from the 2017 USDA Agriculture Census, this article examines the use of reduced tillage, no-till, and cover crops on Nebraska cropland and on the cropland of three adjoining states — Iowa, Kansas, and South Dakota — and the United States as a whole. Table 1 contains the land use practices on cropland farms for these five entities and the percentage of cropland farms and acreage on which these practices were used (Table 2 contains the total acreage). Iowa has the most farms with cropland, while Kansas contains the most acres of cropland. Nebraska lags both states in these categories, while South Dakota has the fewest farms with cropland and total cropland acreage.
While Iowa has the largest percentage of farms (34%) and cropland acreage (38.2%) under reduced tillage, Nebraska comes in second in both categories. Though the U.S. trails all five states in the percentage of farms with cropland under reduced tillage practices, the percentage of cropland acreage under reduced tillage practices is greater in the U.S. than in Kansas. Nebraska noticeably has a larger percentage of farms with cropland using no-till practices and surpasses the U.S. and the other three states on the percentage of cropland acres under no-till. Nebraska, likewise, has a larger percentage of farms with cropland using a cover crop, but slightly lags Iowa in the percentage of cropland acreage planted to a cover crop. Interestingly, all four states considered have a lower percentage of cropland acres planted to a cover crop than the U.S.
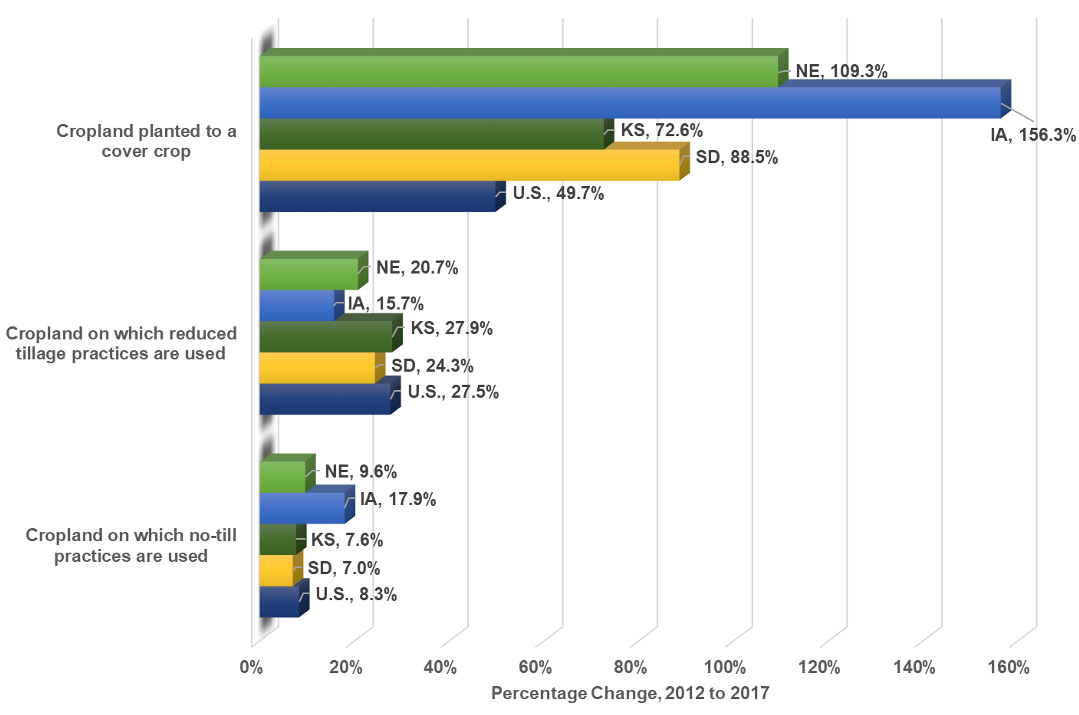
The Census of Agriculture has only been reporting the land use practices considered in this report since the 2012 census. Figure 1 contains the percentage change in acreage from 2012 to 2017, according to the land use practices being considered. Iowa had a 156.3% increase in cropland planted to a cover crop between 2012 and 2017 while Nebraska experienced a 109.3% increase. Overall, the US experienced a 49.7% increase in cropland planted to a cover crop. Kansas had the largest increase in cropland on which reduced tillage practices were used (27.9%), followed by the U.S. (27.5%) and South Dakota (24.3%). Iowa experienced the largest increase in cropland on which no-till practices are used (17.9%), with Nebraska having a 9.6% increase. Given the larger percentage of cropland acreage under no-till in Nebraska, this suggests farmers in Nebraska have been early adopters of no-till.
The data examined in this report was collected in 2017. The 2022 Census of Agriculture will probably show an increase in no-till practices in all states considered and a large increase in the number of acres planted to a cover crop. Given that a larger percentage of land in Nebraska is already engaged in no-till practices than the three surrounding states considered, and the U.S., Nebraska may be somewhat disadvantaged with respect to the additionality principle, depending on how it is interpreted and implemented.
To understand what additionality is and why it is important to carbon markets today, we need to understand the history of U.S. carbon markets. When the first U.S. carbon markets were developed in the 1980s and 1990s, they were part of an air pollution control regulatory program. Power plants were all given emission allowances and clean power plants could sell unused allowances to power plants with higher emissions. These were, and still are today, compliance markets and they are highly regulated.
Today’s carbon markets – and the markets currently being discussed in agricultural circles – are not compliance markets but instead are voluntary markets. And the proposed Growing Climate Solutions Act deals with voluntary markets, not compliance markets. The carbon credits sold in voluntary markets do not have to meet all the requirements of the compliance markets, and are not required to meet additionality requirements (although some think that should be changed).
Additionality in agricultural carbon markets can be illustrated with a numerical example (numbers conjured). My farm sequesters (stores) 70 tons of carbon each year under reduced tillage practices. When I go from reduced tillage to no-till, 110 tons of carbon are stored on my farm each year. In compliance markets – under the additionality principle – I would only have 40 tons to sell. In voluntary markets, however, I could sell up to 110 tons. Therefore, I could perhaps sell 40 tons on the compliance market and sell the remaining 70 tons on the voluntary market, if that was the most profitable option. Compliance carbon credits usually sell for more than voluntary carbon credits.
Some believe that all carbon credits should be subject to additionality, whether sold in compliance markets or in voluntary markets. However, there are good reasons to reward farmers and ranchers to continue storing carbon on their land – if we do not, land practices could be changed to those reducing carbon storage, thereby releasing more carbon into the atmosphere. So both types of activities should be rewarded, but the market is likely to reward them differently. In any event, the additionality debate is likely to continue as we try to develop carbon policies to slow and stop global warming.
References:
Plastina, Alejandro and Oranuch Wongpiyabovorn. 2021. “How to Grow and Sell Carbon Credits in US Agriculture.” Ag Decision Maker, File A1-76, July, Iowa State University Extension and Outreach.
Tables and Figures
| - | Percentage of Cropland Farms and Acreage on Which: | |||||||
|---|---|---|---|---|---|---|---|---|
| - | Total Cropland | Reduced Tillage was Used2 | No-Till Practices were Used | Planted to a Cover Crop3 | ||||
| - | No. Farms | Acres | % of Farms | % of Acres | % of Farms | % of Acres | % of Farms | % of Acres |
| Nebraska | 38,084 | 22,242,599 | 29.6% | 26.8% | 45.7% | 46.1% | 11.6% | 3.4% |
| Iowa | 77,943 | 26,545,960 | 34.0% | 38.2% | 30.8% | 30.9% | 11.2% | 3.7% |
| Kansas | 48,581 | 29,125,505 | 24.6% | 21.7% | 30.9% | 38.6% | 8.6% | 1.4% |
| South Dakota | 25,180 | 19,813,517 | 21.3% | 26.6% | 33.5% | 38.4% | 6.7% | 1.9% |
| United States | 1,475,627 | 396,433,817 | 14.7% | 24.7% | 18.9% | 26.3% | 10.4% | 3.9% |
1Source: USDA NASS, 2017 Census of Agriculture.
2Excluding No-Till.
3Excluding CRP.
| - | Cropland on Which: | - | ||||||
|---|---|---|---|---|---|---|---|---|
| - | Total Cropland | Reduced Tillage was Used2 | No-Till Practices were Used | Planted to a Cover Crop3 | ||||
| - | No. Farms | Acres | No. Farms | Acres | No. Farms | Acres | No. Farms | Acres |
| Nebraska | 38,084 | 22,242,599 | 11,282 | 5,950,801 | 17,389 | 10,256,995 | 4,419 | 747,903 |
| Iowa | 77,943 | 26,545,960 | 26,532 | 10,132,599 | 24,025 | 8,196,199 | 8,729 | 973,112 |
| Kansas | 48,581 | 29,125,505 | 10,338 | 7,746,948 | 16,283 | 11,197,898 | 3,256 | 556,439 |
| South Dakota | 25,180 | 19,813,517 | 6,185 | 4,300,330 | 7,774 | 7,656,188 | 2,154 | 281,649 |
| United States | 1,475,627 | 396,433,817 | 217,069 | 97,753,854 | 279,370 | 104,452,339 | 153,402 | 15,390,674 |
1Source: USDA NASS, 2017 Census of Agriculture.
2Excluding No-Till.
3Excluding CRP
Figure 1. Percentage change in acreage from 2012 to 2017 according to land use. Source: USDA NASS, 2017 Census of Agriculture