On June 24, the Growing Climate Solutions Act of 2021, co-sponsored by Nebraska Sen. Deb Fischer, cleared the U.S. Senate. The act authorizes the Secretary of Agriculture to develop a program that facilitates the participation of farmers, ranchers and private forest landowners in a voluntary environmental credit market, including land or soil carbon sequestration. The program includes ensuring technical expertise, information and tools are available to assist farmers, ranchers and private forest landowners in participating in the program. The act also establishes a third-party verification or certification system and creates a “Greenhouse Gas Technical Assistance Provider and Third-Party Verifier Certification Program Advisory Council,” which is comprised of no less than 51% farmers, ranchers and private forest landowners. The council is to advise the Secretary of Agriculture on how to reduce barriers and costs to participate in the program, and to ensure the program is responsive to the needs of participants.
Although the act has yet to be enacted, a number of private voluntary carbon credit markets are in existence to increase public perception of the company offering carbon contracts or to serve as aggregator of contracts to sell on the market. Farming practices commonly listed as those that can earn credits include planting cover crops and adopting no-till or reduced tillage practices.
Using data from the 2017 USDA Agriculture Census, this article examines the use of reduced tillage, no-till and cover crops on Nebraska cropland. Table 1 contains the number of farms employing these land use practices and the number of acres upon which these practices are used, by size of farm. The number of farms using each practice is not mutually exclusive; in other words, a farm can have some acreage under no-till and some acreage under reduced tillage practices.
Almost 50% of the total cropland in Nebraska is farmed by 5,134 producers with farms of 2,000 acres or more, and all but 27% of the cropland in Nebraska is included in farms of 1,000 acres or more. Similarly, 75% of the acreage in reduced tillage and no-till in Nebraska are from farms with 1,000 acres or more, as are 70% of the acres planted to cover crops. Reduced tillage, no-till and cover crop practices are practiced by a number of farms in each cropland size category.
The percentage of Nebraska cropland farms and acreage that use reduced tillage, no-till and cover crops practices, by farm size, is presented in Figures 1-3. The percentage of farmers in each size category on which reduced tillage is used ranged from 5.6% for the category of one to nine acres, to a high of 45.8% of producers in the 1,000-to-1,999-acre farm size (Figure 1). For every size category, the percentage of farms on which reduced tillage is used is higher than the percentage of cropland acreage on which reduced tillage is used.
For each cropland acreage category, the number of farms using no-till practices and the percentage of acreage in no-till, is greater than the same category for reduced tillage. No-till practices are used on 56.9% of the farms in the 2,000-or-more-acres category and 66% of the farms in the 1,000-to-1,999-acres category, with accompanying 45.3% and 51.1% of the acreage in each category in no-till, respectively (Figure 2). In general, after these two categories, the percentage of farms and the percentage of acreage represented in each size category decreases as the size category decreases.
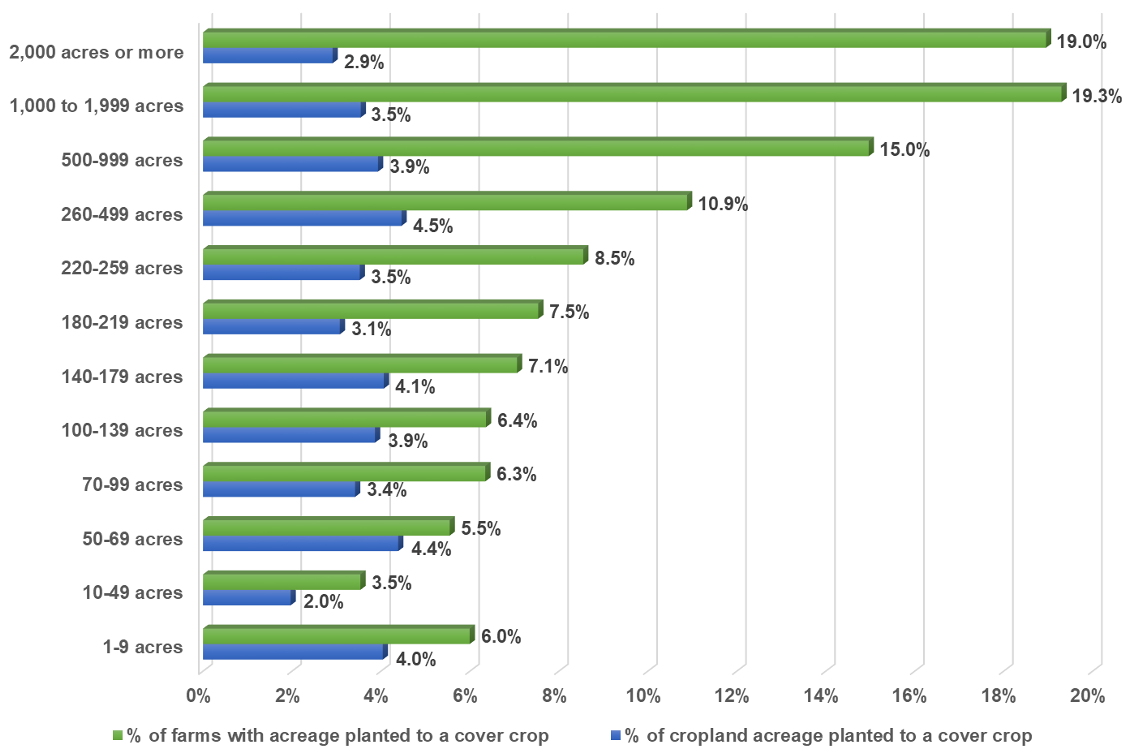
The utilization of cover crops as a land use practice is not as prevalent as no-till or reduced tillage practices. For the two largest acreage categories, cover crops are used on approximately 19% of the cropland farms, but only on 2.9% to 3.5% of the acreage represented in these categories. The percentage of farms utilizing cover crops generally decreases for each acreage category below these two largest categories, while the percentage of acreage in some of the categories reaches above 4%.
It appears that there is plenty of acreage in Nebraska that can contribute to the reduction in greenhouse gases and earn extra income through participating in the carbon markets that are outlined by the act. What, though, would it take to entice Nebraska farmers to place additional acreage into reduced, no-till or cover crop practices? In a 2017 survey conducted by the University of Tennessee (Campbell, et al., 2018), approximately 40% of row crop producers in west and middle Tennessee stated they would adopt cover crops if presented a cost-share of $15/acre. With a cost-share of $77/acre, close to 90% stated they would adopt cover crops. The 2021 University of Nebraska Cover Crop Enterprise Budgets estimate the cost of establishing cover crops under conventional tillage to be $42.77/acre and, under no-till, to be $47.63/acre. This does not account for any value that could accrue from using the cover crop such as livestock grazing or the economic value from building organic matter in the soil.
The University of Tennessee (Campbell, et. al., 2018) survey also asked respondents what cost-share would be required to adopt no-till practices. Respondents must have viewed no-till to have greater benefits and/or lower costs than cover crops, as almost 65% would adopt no-till at a cost-share of $5/acre, and over 90% stated they would adopt no-till with a cost-share of $25/acre. While the 2021 University of Nebraska crop enterprise budgets were not developed for the express purpose of comparing no-till to conventional tillage, they typically show a tradeoff between equipment costs required for conventional tillage and the additional chemical costs required for no-till. For example, comparing conventional vs. no-till for continuous dryland corn in eastern Nebraska (Budget #17 vs. Budget #20) with material and services costs to be $39.47/acre greater for no-till, but field operations to be $24.99/acre greater for conventional tillage. After figuring in the additional yield anticipated for no-till (180 bu/ac vs 160 bu/ac), total costs/bu was $3.44 for no-till and $3.77 for conventional tillage.
While each farming operation has its unique characteristics that dictate the use of reduced tillage, no-till and cover crop use on their crop acreage, the Growing Climate Solutions Act of 2021, if enacted, holds promise for additional income for many Nebraska farmers.
References:
Campbell, Kelsey M., Christopher N. Boyer, Dayton M. Lambert, Christopher D. Clark and S. Aaron Smith. 2018. “Risk Preferences and Producers’ Willingness to Adopt Cover Crops and No-Till.” Invited presentation at the 2018 Southern Agricultural Economics Association Annual Meeting, February 2-6, Jacksonville, Florida.
Table and Figures
| - | Cropland on Which: | - | - | - | - | - | ||
|---|---|---|---|---|---|---|---|---|
| - | Total Cropland | Reduced Tillage was Used2 | No-Till Practices were Used | Planted to a Cover Crop3 | ||||
| - | No. Farms | Acres | No. Farms | Acres | No. Farms | Acres | No. Farms | Acres |
| 1-9 acres | 1,401 | 5,172 | 78 | 187 | 150 | 527 | 84 | 209 |
| 10-49 acres | 5,143 | 91,145 | 404 | 7,007 | 876 | 15,981 | 182 | 1,795 |
| 50-69 acres | 1,082 | 45,806 | 107 | 4,276 | 262 | 10,248 | 60 | 2,010 |
| 70-99 acres | 2,064 | 125,998 | 326 | 17,083 | 678 | 38,599 | 131 | 4,307 |
| 100-139 acres | 1,619 | 138,735 | 328 | 24,730 | 540 | 39,775 | 103 | 5,365 |
| 140-179 acres | 2,536 | 306,419 | 575 | 55,607 | 979 | 100,741 | 179 | 12,457 |
| 180-219 acres | 1,088 | 160,396 | 280 | 29,972 | 462 | 53,464 | 82 | 4,934 |
| 220-259 acres | 1,205 | 218,396 | 368 | 49,941 | 587 | 88,064 | 103 | 7,696 |
| 260-499 acres | 5,431 | 1,532,553 | 1,891 | 368,206 | 2,851 | 643,595 | 591 | 68,387 |
| 500-999 acres | 6,127 | 3,373,596 | 2,387 | 916,004 | 3,618 | 1,591,461 | 917 | 132,729 |
| 1,000 to 1,999 acres | 5,254 | 5,489,483 | 2,406 | 1,595,489 | 3,467 | 2,803,079 | 1,014 | 194,713 |
| 2,000 acres or more | 5,134 | 10,754,900 | 2,132 | 2,882,299 | 2,919 | 4,871,461 | 973 | 313,301 |
| Total | 38,084 | 22,242,599 | 11,282 | 5,950,801 | 17,389 | 10,256,995 | 4,419 | 747,903 |
1Source: USDA NASS, 2017 Census of Agriculture.
2Excluding No-Till
3Excluding CRP
Figure 1. Percentage of Nebraska cropland farms and acreage on which reduced tillage (excluding no-till) practices are used. Source: USDA NASS, 2017 Census of Agriculture
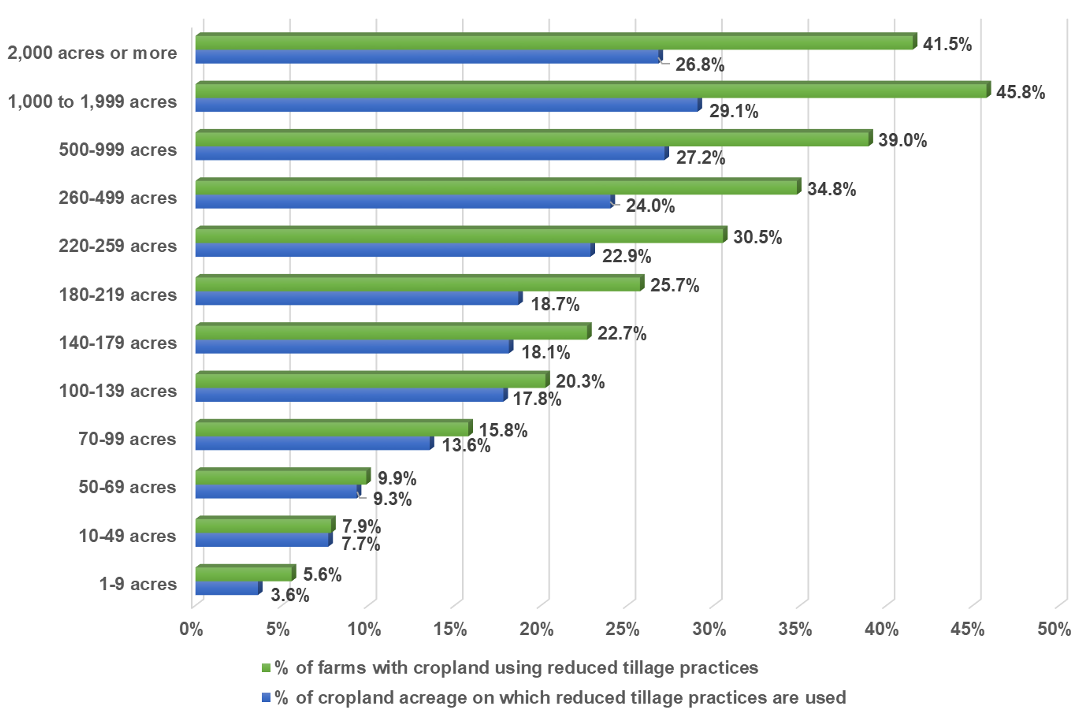
Figure 2. Percentage of Nebraska cropland farms and acreage on which no-till practices are used. Source: USDA NASS, 2017 Census of Agriculture
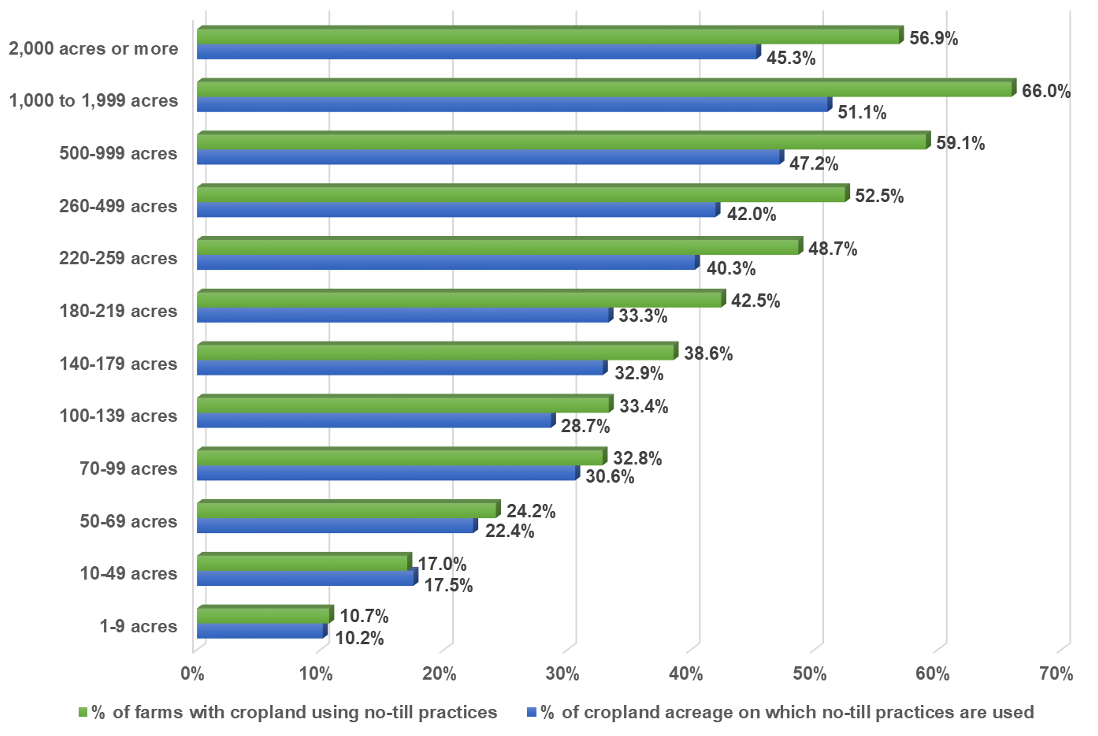
Figure 3. Percentage of Nebraska cropland farms and acreage planted to a cover crop (excluding CRP). Source: USDA NASS, 2017 Census of Agriculture.