
Updated 8/26/26
Quick Links
2026 Cropland & Pasture County Maps 2026 Cropland & Pasture County Data Table
Survey findings from the USDA-National Agricultural Statistics Service (USDA-NASS) report county-level cash rent estimates in Nebraska for the 2026 growing season (USDA-NASS 2026). These estimates provide average cash rents for non-irrigated and irrigated cropland and pasture on a per-acre basis. Differences in soil type, rainfall, yield expectations, and market competitiveness among counties cause variations in non-irrigated cropland rental rates across Nebraska (Figure 1). Counties shown in light gray either lacked sufficient survey responses to estimate a rate or were in state regions with a low occurrence of a specific production practice.
Figure 1. 2026 Non-Irrigated Cropland Cash Rent in Nebraska
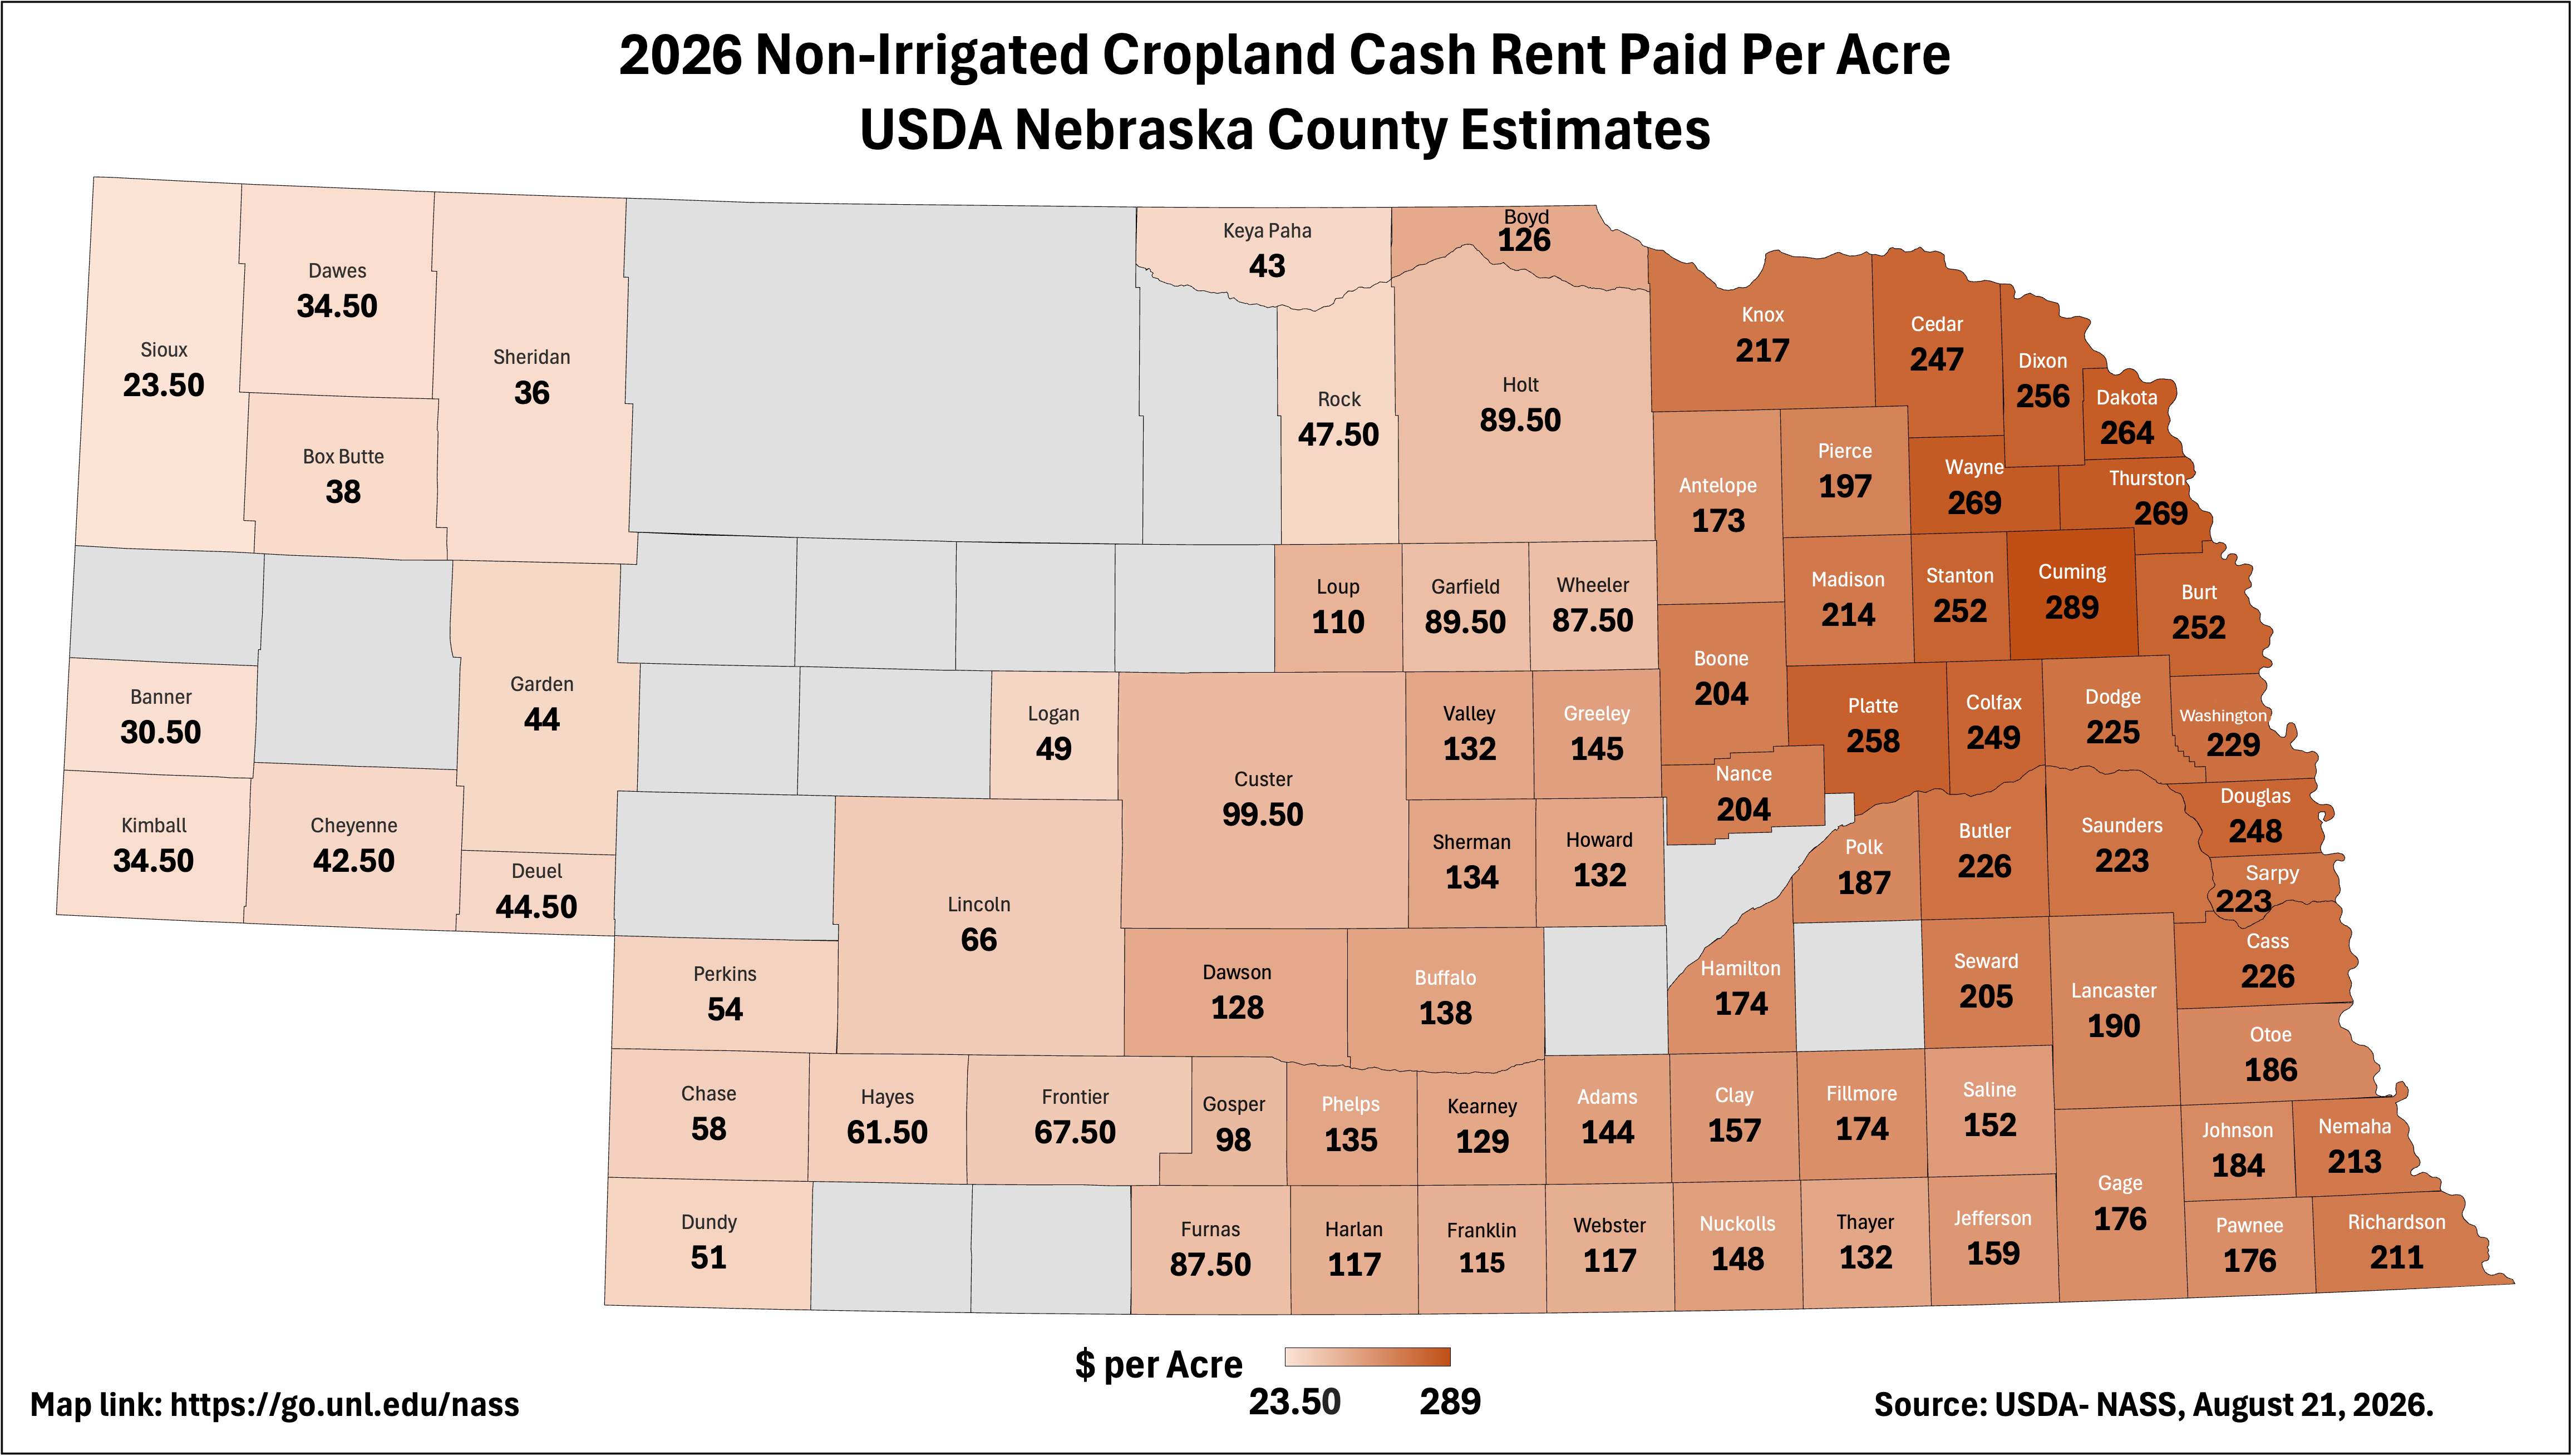
Source: 2026 Nebraska Cash Rents by County; USDA-National Agricultural Statistics Service, August 21, 2026. Click to enlarge map.
Trends in irrigated cash rental rates for 2026 reflect those of non-irrigated cropland (Figure 2). Areas with low response rates to the cash rent survey or with few irrigated acres did not report rates. The reported irrigated cash rental rates do not differentiate between center pivot, gravity, or flood irrigated acres. The average represents a weighted calculation of the county's center pivot, gravity, and flood irrigation methods. Additionally, the reported rates assume that the landlord owns the entire irrigation system for the leased property. Rates may be adjusted if the tenant provides the pivot, power unit, or other irrigation system components.
Cropland cash rental rates moderated across Nebraska in 2026. Elevated interest rates and rising input expenses continue to pressure overall farm profitability. Combined with lower commodity prices, these economic forces may place additional downward pressure on future cash rental rates. Overall, cash rental trends reflected a market adjusting to tighter profit margins and elevated production expenses across the state.
Figure 2. 2026 Irrigated Cropland Cash Rent in Nebraska
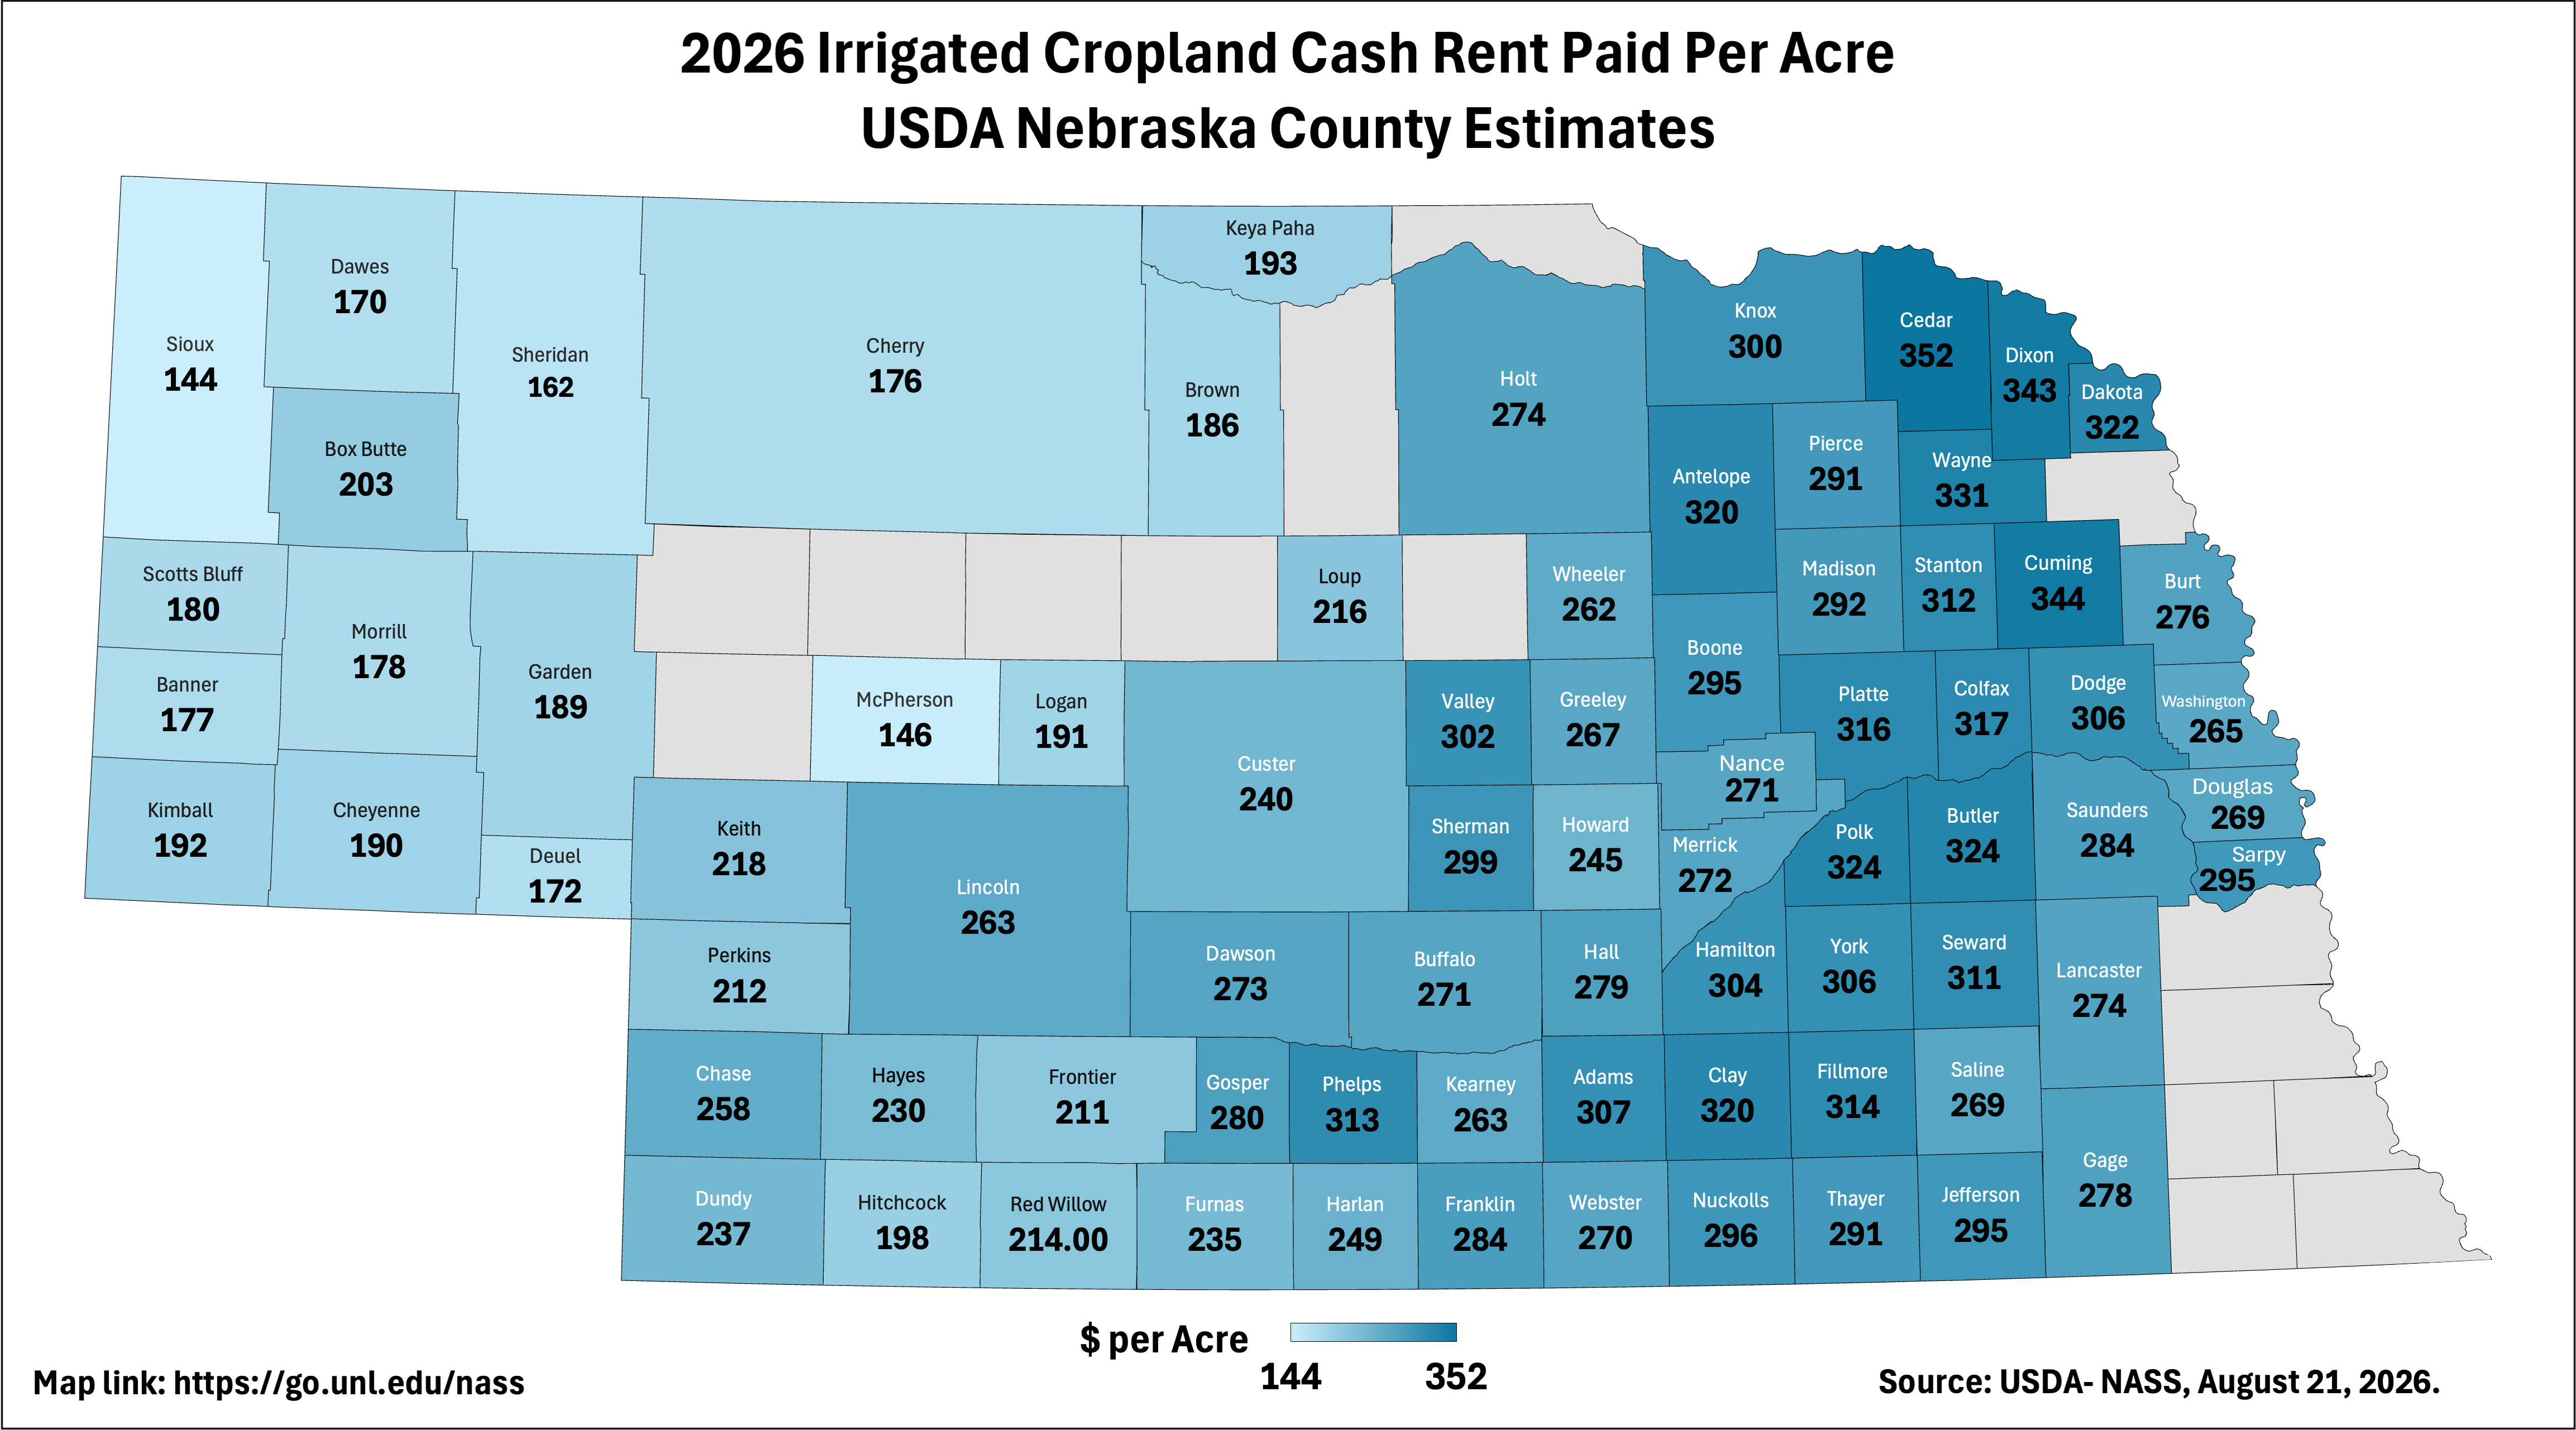
Source: 2026 Nebraska Cash Rents by County; USDA-National Agricultural Statistics Service, August 21, 2026. Click to enlarge map.
Nebraska's pasture land rental rates vary with stocking rates, productivity, and market competitiveness (Figure 3). The reported rates reflect the amounts paid during the summer months. Off-season grazing rental rates may be adjusted based on forage dormancy, quality, or other property features during the fall, winter, or spring calving season. This off-season period can also be affected by winter snowfall or other weather conditions. Areas with limited pasture acres or low response rates in the cash rent survey did not report county rates.
Figure 3. 2026 Pasture Cash Rent in Nebraska
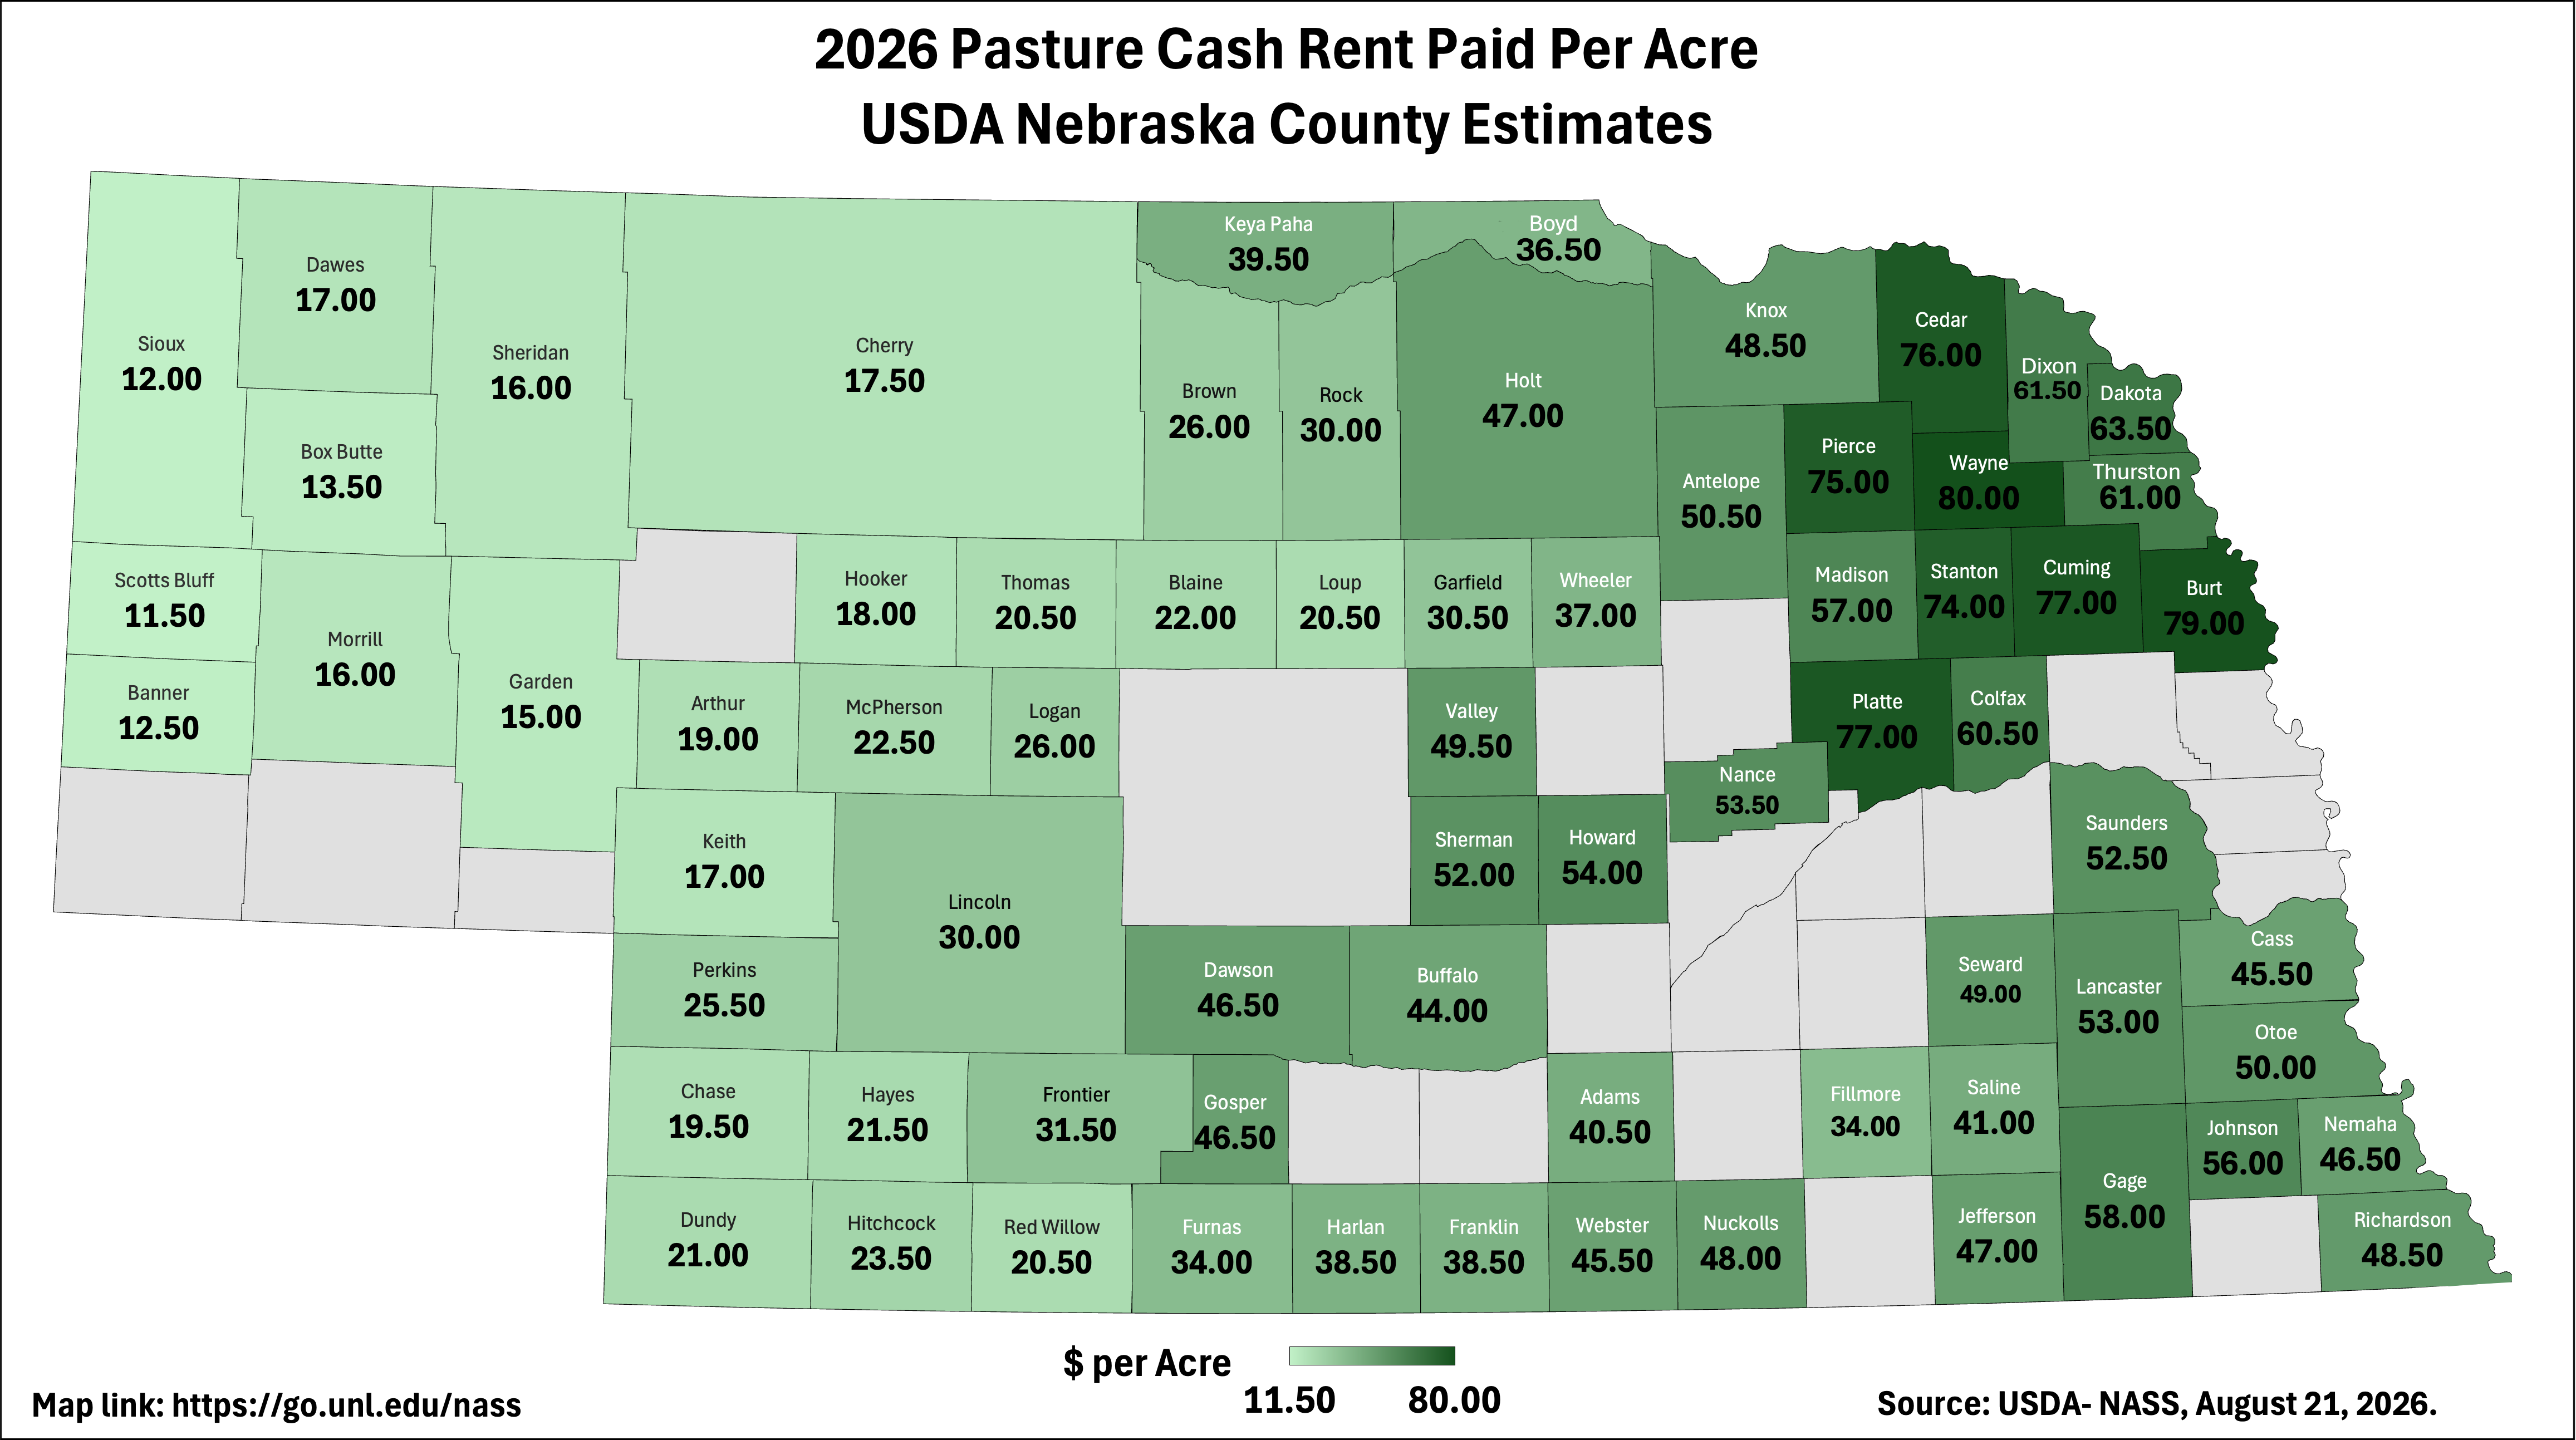
Source: 2026 Nebraska Cash Rents by County; USDA-National Agricultural Statistics Service, August 21, 2026. Click to enlarge map.
Pasture and grazing land cash rental rates across Nebraska remained elevated in 2026. Higher cattle prices continued to support strong demand for leased grazing acres. Drought conditions tightened forage availability in parts of the state, while hay prices generally trended higher due to limited rainfall and reduced production. On average, the 2026 grazing land rental market remained strong, supported by profitable livestock returns and sustained demand for grazing land.
Additional details on the USDA-National Agricultural Statistics Service land values and cash rental publications may be found in the reference section of this article or by clicking the County Maps or Data Table buttons at the beginning of this article.
Jim Jansen, (402) 261-7572
Agricultural Economist
University of Nebraska-Lincoln
jjansen4@unl.edu
References
USDA-National Agricultural Statistics Service. (2026, August 21). Cash Rents by County. Retrieved August 21, 2026, from: https://www.nass.usda.gov/Surveys/Guide_to_NASS_Surveys/Cash_Rents_by_County/.
Map Archive
2025 Nebraska County-Level Cash Rents


