Indemnity and cost rank matrix for Multi-Peril Crop Insurance (MPCI) showing how YP, RP-HPE, and RP policies perform under the six conditions of expected production, price and trend risks
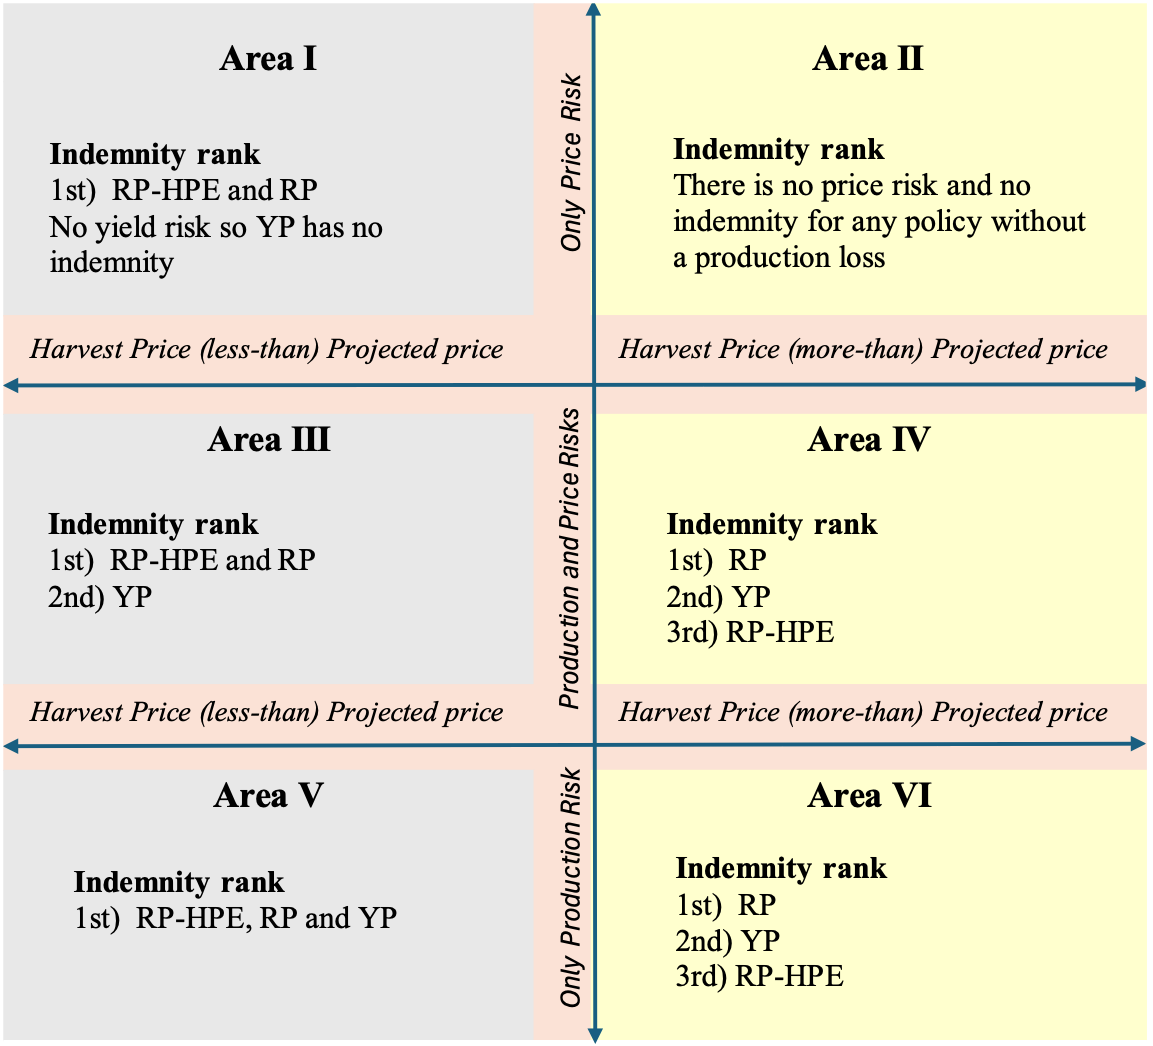
Notes
- A seventh condition exists when neither production risk nor price risk is present.
- Historically, low-price scenarios occurred 69% of the time and high-price scenarios occurred 31% of the time.
Image description
The matrix in the graphic on this page shows six crop insurance scenarios based on price risk (horizontal axis: harvest price below vs. above projected price) and production risk (vertical axis: none, price only, or production plus price risk). Each quadrant lists indemnity rankings for RP-HPE, RP, and YP policies. When harvest price is lower than projected, RP-HPE and RP generally provide the highest indemnities; when prices are higher, RP is typically highest. YP only provides indemnity when there is a production loss. A note indicates a seventh scenario with no risk. Historical occurrence: 69% in low-price scenarios, 31% in high-price scenarios.