This article was first published by UNL's Department of Agricultural Economics as part of its "Cornhusker Economics" series on April 23, 2025.
Recently, the UNL-TAPS program in North Platte had its end-of-the-year banquet and celebrated another successful season of competition and education. As one who is familiar with the program, it was wonderful to see so much excitement about the results and the many good conversations about productivity and profitability. One of the three awards in the TAPS contest is the coveted water and nitrogen use efficiency award. This award is for the most efficient use of irrigation water and nitrogen fertilizer. This award is given to the team/competitor from the relevant contest that, during the current year’s contest, has the most efficient use of added water, irrigation (I), and added nitrogen fertilizer (N).
These efficiencies are calculated using the water nitrogen intensification performance index score (WNIPI) developed specifically for the program. This index compares the production effect of applying added I and N compared to the base productivity resulting from the unaltered, natural levels of N and water. The greater the value of the WNIPI, the more efficient the user is in applying both inputs. While this is a useful tool to measure different efficiencies among competitors, it has some challenges in its usefulness as a measure to be widely adopted by practitioners. This is primarily due to the complexity of the equation and the need for a localized base yield, see Equation 1.
Equation 1. Water Nitrogen Intensification Performance Index (WNIPI)
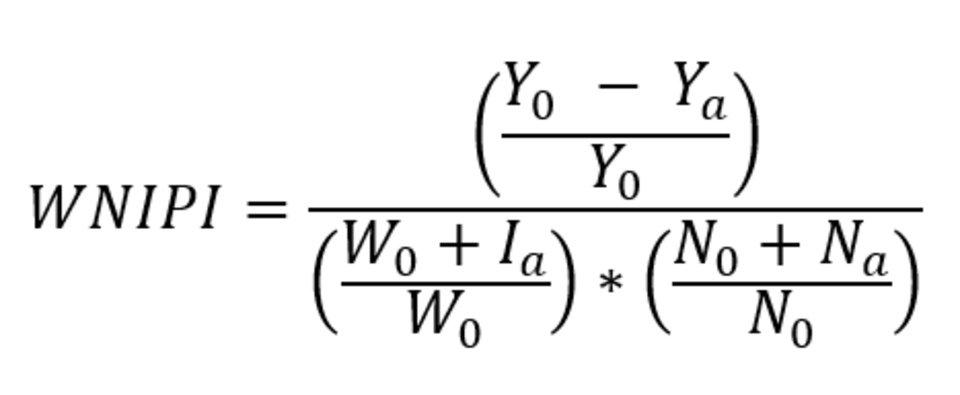
Where Y0 is the base yield and Ya is the yield with the additional N and I, W0 is the available water, Ia is the added water and N0 is the existing level of N in the soil prior to the addition of Na, the added pounds of N fertilizer. This complex mix of variables makes it difficult to relate changes in I or N to Y. The denominator is the product of the overall percent use of all W in terms of unirrigated W times the overall percent usage of all N to the unamended amount of N. This makes it difficult to visualize the actual relationship between the WNIPI score and applied quantities of I and N. However, it is an accurate measure of efficiency differences among the many plots found in the TAPS contest.
To illustrate this point, consider Table 1 below, where Farm #16, with the largest WNIPI score of 0.168, ranked as the most biologically efficient, versus Farm #6, with a WNIPI score of 0.141, ranked 4th, making Farm #16 more efficient than Farm #6 by 0.027 WNIPI points. The question now becomes, how does this measure help with future choices to increase efficiency? Unfortunately, this particular measure is complex and has many possible explanations that relate to its value. The fact that its parts are unitless makes it harder to comprehend and discover the relatable factors. Since the values are in percentage changes, everything is in relative terms to the individual circumstance. Since each farm is unique, those differences are not easily compared or understood in common terms, e.g., pounds/acre, inches/acre, or bushels/acre.
If, on the other hand, efficiency were measured in commonly relatable terms, that information could be more easily used as a benchmark or guide due to its transparency among the inputs and outputs driving productivity and profitability.
Table 1. Using the WNIPI, the top eight ranked competitors for the North Platte, Nebraska, 2024 Irrigated Corn contest results shown along with added irrigation (I), (N) fertilizer, competitor number, yield (Y) increase, net revenue, dollar returned to dollars spent on I and N, ratio of return (DRIN), net return of I and N (NRIN), and lastly the WNIPI value.
| WNIPI | I(rrigation) | N(itrogen) | Farm | Costs/Acre | Yield Gain | Value Gain | DRIN | NRIN | WNIPI |
| Rank | Inches/Acre | Lbs./Acre | # | $/Acre | Bu/Acre | $/Ac | $Gain /$Spent | $/Acre | % change Y/ (% total W* % total N) |
1 | 7.76 | 110 | 16 | $125.59 | 78.2 | $319.76 | $2.55 | $194.17 | 0.168 |
2 | 7.13 | 175 | 36 | $161.99 | 87.2 | $356.73 | $2.20 | $194.74 | 0.159 |
3 | 7.71 | 90 | 18 | $104.78 | 67.7 | $277.06 | $2.64 | $172.28 | 0.156 |
4 | 8.96 | 192 | 6 | $173.61 | 86.9 | $371.95 | $2.14 | $198.34 | 0.141 |
5 | 6.59 | 140 | 19 | $126.70 | 68.9 | $281.92 | $2.23 | $155.22 | 0.141 |
6 | 8.89 | 205 | 28 | $183.48 | 82.4 | $337.68 | $1.84 | $154.20 | 0.129 |
7 | 7.96 | 140 | 25 | $136.31 | 64.7 | $268.69 | $1.97 | $132.38 | 0.125 |
8 | 5.64 | 155 | 7 | $138.40 | 60.7 | $249.75 | $1.80 | $111.34 | 0.124 |
The WNIPI does little to answer the question of how I and N efficiency translates into impact on factors of business sustainability and capital use. These two factors can relate to the adoption of new practices and technology that foster more efficient application of I and N. There are efficiency measures that provide an increased understanding of the linkages of the physical world to the business aspects of using I and N. These measures integrate cost and revenue along with productivity. When these measures are used appropriately, they provide practitioners with the information needed to make balanced, resource-efficient decisions that consider both net returns and expenses. This has the added benefit of helping them develop concrete objectives and formulate operationally sound plans.
Alternative Measures
The first alternative measure, DRIN, is not a unitless measure. However, it is a widely applicable and usable metric of dollar efficiency. It is obtained by dividing the value of the added production (yield) by the cost of the related inputs (I and N). The DRIN, Equation 2, is a single ratio of added revenue in $/acre divided by the sum of the added costs of I and N in $/acre.
Equation 2. Dollar Return for each dollar spent on I and N (DRIN)
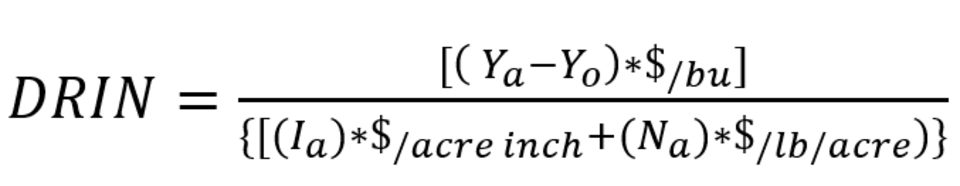
Added revenue is measured as the change in quantity, number of bushels per acre (bu/ac), the difference between (Ya–Y0), times average price received per bushel ($/bu). This value is divided by the sum of the added acre inches of water, Ia per acre, times the cost per acre inch ($/ac in), added to the cost of added fertilizer, the pounds of (Na) times its cost per lb ($/lb). This normalized metric represents dollars returned from grain sales for each dollar spent on I and N for one acre. Using Table 1 results, farm #18 has the highest DRIN of $2.64. For every dollar spent on irrigation and fertilizer, this team gained $2.64 in revenue.
The second measure captures profit efficiency. This measure is identified as the Net Return to I and N application or NRIN, shown in Equation 3.
Equation 3. Net Return to Irrigation and N application (NRIN)
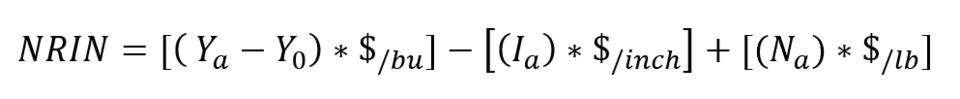
This second alternative is calculated as the difference between the change in revenue and the combined costs of added irrigation and nitrogen. Notably, the factors in DRIN and the NRIN are the same three factors, added revenue, costs of I, and cost of added N. However, DRIN uses them in a ratio and NRIN as a summation. In the case of the NRIN, the calculated result represents the net return to the use of I and N. Simply stated, the larger the NRIN, the greater the net return from the investment in I and N. The farm with the largest NRIN has the greatest net return of I and N.
Summary
The WNIPI is a purely physical measure of I and N efficiency and was developed to determine efficiency winners in several TAPS contests. DRIN is a powerful tool in measuring the effectiveness of the dollars spent on I and N. It is a ratio of dollars returned as revenue in terms of dollars spent. The third measure, NRIN, is an overall measure of economic gain. It is the difference in money spent on I and N versus the revenue taken in and measures the volume of net returns. Both DRIN and the NRIN measure dollar effectiveness dependent on the biological process tempered by the value of the inputs I and N, with respect to output or crop value.
Farm #16 has the highest WNIPI rank and is the most efficient farm in its use of I and N in the production of Y. Farm #18 is the most effective in getting a return for each dollar spent. Of the $104.78/acre spent on I and N, this group gained $277.06/acre in capital, making the DRIN a score of $2.64 for every $1 spent on I and N. Farm #6 is the leader in gaining the greatest net return ($198.35/acre). This team spent the second-highest amount of $173.61/acre on I and N but ranked highest in total return of $371.95.
The fact that outcomes vary by measure is not surprising. Physical efficiency does not automatically relate to costs or revenue. It is natural to expect at least some correlation; however, depending on the efficiency being sought, costs may become a heavy burden. In many cases, efficiency itself has a cost, and to achieve it often requires added costs or a reduction in revenue relative to a reduction in overall productivity (diminishing return). It is the job of the farm manager to balance desired outcomes to meet their individual objectives and goals. Each farm and year are unique and requires careful management to balance productivity, costs, and revenues. Tracking the DRIN and NRIN through time can help develop the skill to make wiser choices and needed adjustments to these three factors.
Webinar Recording
Irrigation Efficiency Ratios Webinar Recording (April 17, 2025)