At a Glance
- Deer and antelope leases dominate Nebraska hunting demand (49% statewide).
- Pheasant, turkey, and waterfowl leases vary widely by region.
- Vegetation, water access, and topography drive lease value most.
- Most leases earn under $2,500 per year; only 1% exceed $10,000.
- Whole-parcel access boosts desirability and income potential.
This article was first published as part of the UNL Department of Agricultural Economics' "Cornhusker Economics" series on Aug. 20, 2025.
The Nebraska Farm Real Estate Market Survey and Report 2024-2025 provides insight into recent trends in the market value of land and cash rental across the state. Each year, the special feature section covers topics on new or emerging issues related to the agricultural land industry in Nebraska. These topics reflect the interest expressed by panel members and readership of the Nebraska Farm Real Estate Market Highlights Reports. The special feature section in 2025 focuses on hunting rental arrangements in Nebraska, including the types of wild game commonly hunted and the value associated with leasing these rights.
Landowners seeking to make additional income off their property outside of the traditional agricultural use or rental arrangements (where the hunting rights have not been granted to the tenant) may choose to lease the right to exclusively hunt certain types of wild game to a third party (Ferrell, et al. 2023). Table 1 summarizes comparisons of hunting leases for wild game in Nebraska as part of the 2025 contractual agreements for each district. Panel members were asked to estimate the percentage of hunting leases for antelope or deer, pheasants or quail, turkey, waterfowl, and other game within their district across the state. The other game category included hunting leases for any species outside of the other identified categories.
Agricultural Statistics District | Average Percent Distribution | ||||
Antelope or Deer | Pheasants or Quail | Turkey | Waterfowl | Other Game | |
Percent | |||||
| Northwest | 41 | 18 | 6 | 35 | 0 |
| North | 57 | 5 | 24 | 9 | 5 |
| Northeast | 53 | 21 | 6 | 17 | 3 |
| Central | 45 | 9 | 14 | 31 | 1 |
| East | 48 | 17 | 9 | 24 | 2 |
| Southwest | 34 | 29 | 12 | 18 | 7 |
| South | 42 | 24 | 21 | 13 | 0 |
| Southeast | 54 | 15 | 19 | 8 | 4 |
| State | 49 | 17 | 13 | 19 | 2 |
Approximately 49% of the wild game leases in Nebraska were for antelope or deer, making this category the most popular across all districts and the state (Table 1). Pheasants or quail, turkey, waterfowl, and other game constituted 17%, 13%, 19%, and 2%, respectively, of the remaining categories. The pheasants or quail category in the Northeast, Southwest, and South Districts, accounting for 21%, 29%, and 24% of the leases, respectively, showed a higher level of interest in these regions of Nebraska. Panel members also noted that the value of these leases may be significantly affected by the vegetation and terrain type associated with the property.
Hunting rights for turkeys received the most interest in the North, South, and Southeast Districts, accounting for 24%, 21%, and 19% of the lease comparisons. The Northwest, Central, and East Districts denoted the most significant interest for waterfowl. These regions follow portions of the Platte River and contain features highly desirable to waterfowl during periods of the hunting lease. The types of other game were not specified as part of the survey, and received the lowest responses among the five categories. In the Southwest, 7% of the hunting leases were for other game, which led to the highest response rate among the eight districts.
Different types of vegetation, conservation practices, or topography features may influence the value of a hunting lease for a specific property. The desirability of the hunting lease may be influenced by the specific combination of these features (Mengak, 2024). Properties that feature a diverse mix of these elements are often seen as offering higher quality hunting experiences. This variety might attract a broader range of hunters and increase demand or potential lease value. In competitive markets, such characteristics can significantly set one property apart from others.
Understanding the key features that drive hunting lease value helps landowners and prospective hunters make informed decisions. Figure 1 summarizes the major features contributing the most value to hunting leases across Nebraska. The most common features reported by panel members, in order, were vegetative cover, proximity to water, topography, conservation practices, and other factors at 37%, 25%, 19%, 17%, and 2%, respectively The hunting lease provisions, contract duration, and the type of wild game found on a property all affect the value of the hunting lease (Pierce & Milhollin, 2024). Recognizing these features may assist in tailoring properties to better structure hunting leases and their potential returns.
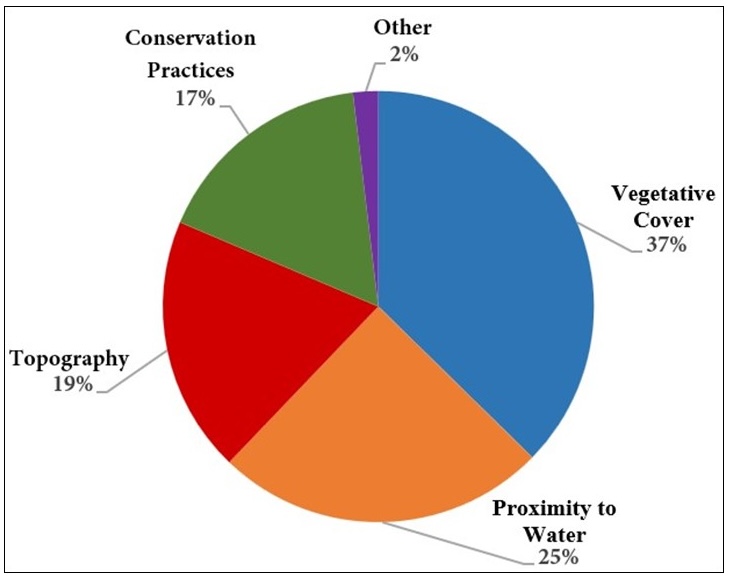
(Source: UNL Nebraska Farm Real Estate Market Survey, 2025)
Evaluating income potential from hunting leases provides valuable insight into the rights associated with the pursuit of different types of wild game in Nebraska. Figure 2 summarizes the average annual income for leasing hunting rights on a property in Nebraska. Panel members reported the average income‑earning potential for leasing of hunting rights to agricultural leases across Nebraska in 2025. Ranked in order of income‑earning potential, these categories include $0 to $2,499, $2,500 to $4,999, $5,000 to $9,999, and $10,000 or more, with rates of 62%, 29%, 8%, and 1%, respectively. These figures show that while most properties produce modest returns, a small portion can generate higher income.
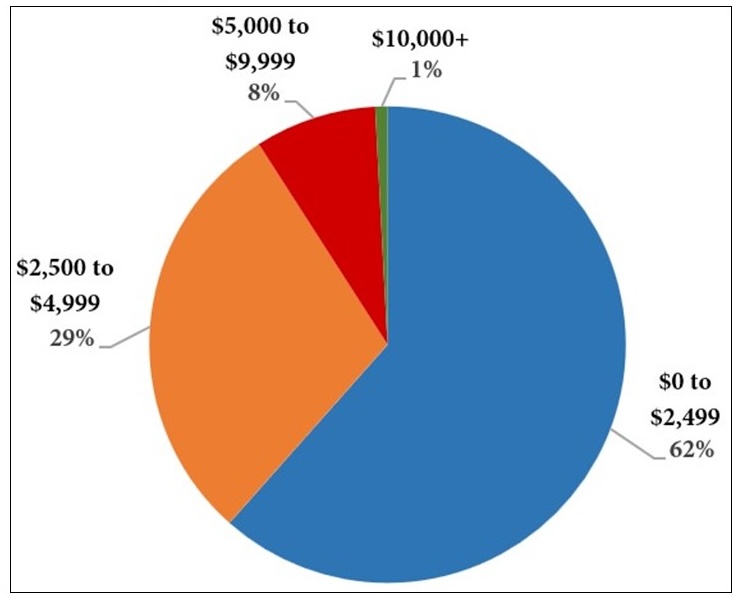
(Source: UNL Nebraska Farm Real Estate Market Survey, 2025)
The value of an agricultural property for hunting wild game, according to panel members, depends on the hunter’s ability to gain rights to the whole parcel rather than renting on a per-acre basis. Estimating the income potential of an agricultural property per acre becomes challenging as hunters value contiguous land with distinctive geographical features that draw desired game. Properties with full access to large, uninterrupted tracts may tend to be more desirable for hunting leases. In many cases, hunting leases might provide supplemental income that supports broader use of the property throughout the year. This makes hunting rights an essential consideration for both current and future generations.
Survey results shown and discussed in this report are findings from the University of Nebraska–Lincoln 2025 Nebraska Farm Real Estate Market Survey. The survey's complete results can be found on the Nebraska Farm Real Estate website: http://cap.unl.edu/realestate.
Please address questions regarding the 2025 Nebraska Farm Real Estate Report to Jim Jansen at (402) 261-7572 or jjansen4@unl.edu.
References
Ferrell, S. I., Porter, M. D., & Elmore, D. (2023, June). Lease Hunting Opportunities for Oklahoma Landowners, retrieved June 12, 2025, from Oklahoma State University Extension.
Mengak, M. T. (2024, October 24). Tips for Creating a Hunting Lease Agreement, retrieved June 10, 2025, from University of Georgia Extension.
Pierce II, R., & Milhollin, R. (2024, October). Landowners’ Guide to Lease Hunting in Missouri, retrieved June 13, 2025, from University of Missouri Extension.