There has been lots of commentary among consumers about gas prices as we unofficially head into summer. Nationally, regular gasoline prices had begun slowly to come off of their all-time highs of $5.01 per gallon in June 2022, to a new low of $3.09 per gallon in January 2023. Prices have risen steadily over the last several months, to $3.57 per gallon, as of the last week in May 2023. Higher gasoline prices tend to reduce travel as total costs for vacations and trips increase. Ultra-low-sulfur diesel has also come down from its high of $5.78 per gallon in June 2022. But different from regular gasoline, it has continued to decline to $3.85 per gallon nationally. This puts diesel prices at similar nominal price levels as in 2012-2015.
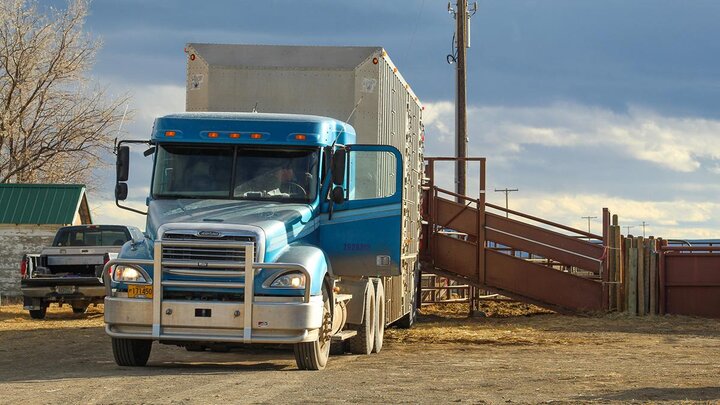
Diesel is one of the primary inputs in the transportation of goods throughout the United States. Livestock hauling is no exception. Feeder cattle are generally transported long distances in the fall as they move from summer grazing to placement in backgrounding operations or directly into feedlots. Cattle, and other livestock in general, can handle transportation stress fairly well – to a point. Trucking feeder cattle long distances can impact animal health outcomes, and improper animal handling can lead to bruised or injured cattle. These negative impacts can generally be offset by appropriate stocking densities, proper trailer ventilation, correct animal handling techniques during loading and unloading, and truck and trailer sanitation.
The Beef Quality Assurance Transportation (BQA-T) certificate is one way the industry is taking steps to address the potential negative effects of trucking. Most states have an extension specialist who can provide this training and certification.
Fed cattle implied trucking premiums and discounts
As much as we know about the potential animal impacts due to transportation, little is publicly or widely known about the pricing mechanisms of trucking. This is assumed to vary by the type of livestock, length of the trip, the load fill, length of the trailer, and the season/weather condition. Publicly available bid pricing for livestock hauling has recently ranged from $2 to $4.50 per loaded mile, but these can vary significantly. While data on transportation costs is generally lacking, an implied cost of transportation can be derived from Mandatory Price Information for fed cattle.
Regardless of marketing method, cattle can be sold live or dressed, and transportation can be either Free on Board (FOB) or delivered. FOB indicates the processing plant pays for transportation and assumes the animal risk once loaded at the feedlot. Delivered indicates the feedlot is required to deliver the cattle to the plant and takes on the transportation risk. Some plants have preferences on how cattle are transported while others allow for producers to choose.
The implied trucking cost can then be calculated as:
Trucking Premium/Discount = Delivered – FOB.
Positive numbers indicate that packing plants are willing to pay a premium ($/cwt.) to have cattle delivered. Negative numbers indicate that packing plants want to set up the trucking. I use data on steers, live and dressed, from the 5-area average, Nebraska, and the Iowa/Minnesota region. I compare how the premiums have changed over time, the seasonality, and the trucking premiums/discounts by region. This data is reported weekly but I aggregate up to monthly data for ease of presentation. The weekly data shows much more variation whereas the monthly data allows us to focus more on the broad trends over time, within a year, and across regions.
Premiums to deliver cattle to meat processing plants
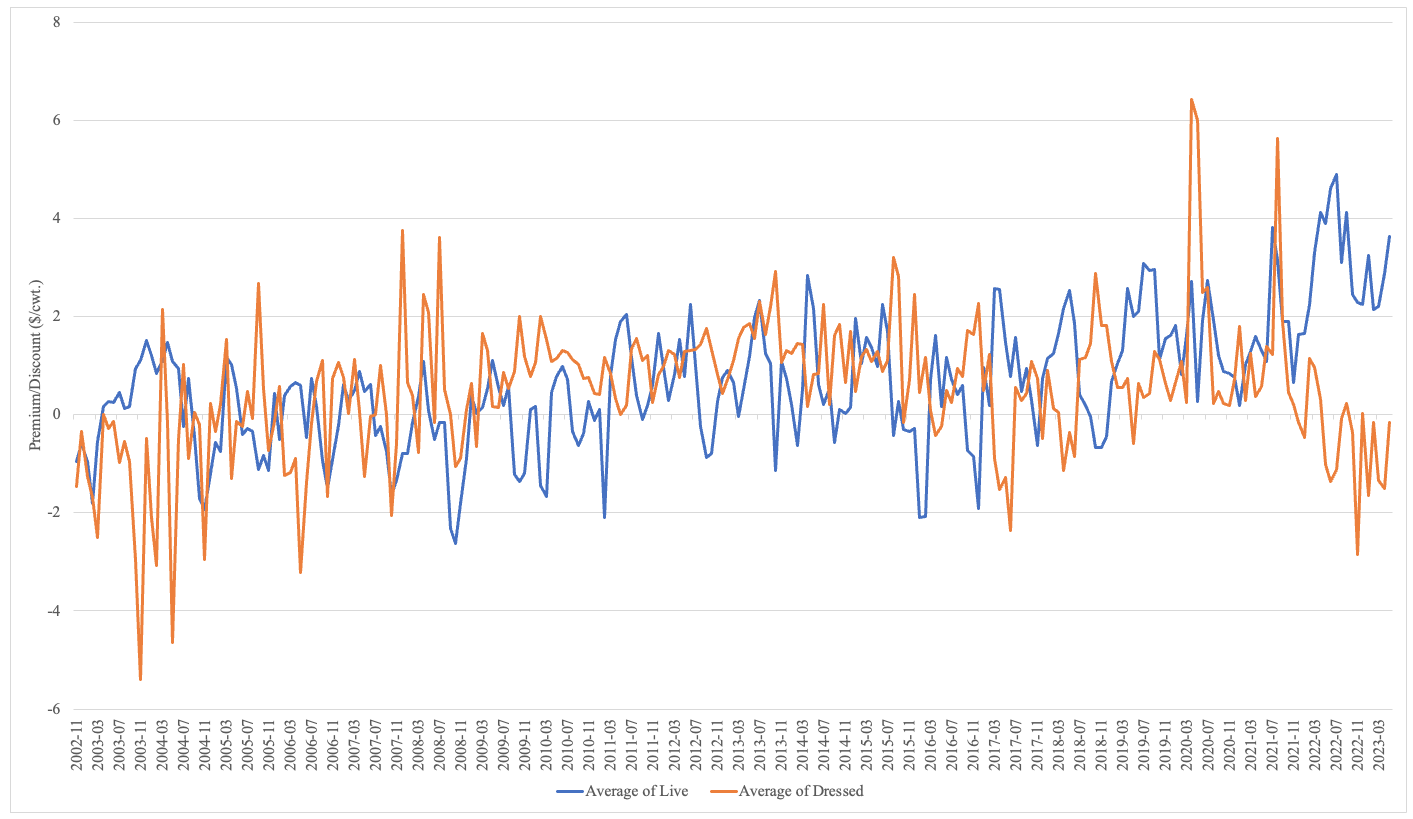
Are there premiums to deliver fed cattle to processing plants? It depends. Figure 1 shows the trend in live and dressed trucking premiums and discounts from November 2002 to May 2023. Producers can expect to receive premiums/discounts depending on whether cattle are sold live or dressed. However, on average, since 2010 premiums have been more often positive than negative. There has also been a slight increase in the trend from 2018-2023 for cattle that are sold live. As shown in Figure 1, the past year there has brought a large divergence in the implied hauling rates for live and dressed. Live has become more positive, and dressed has become more negative.
Figure 1. Implied Fed Cattle Hauling Premiums/Discounts for Steers, 5-area Average, 2002-2023.
Seasonality of transportation
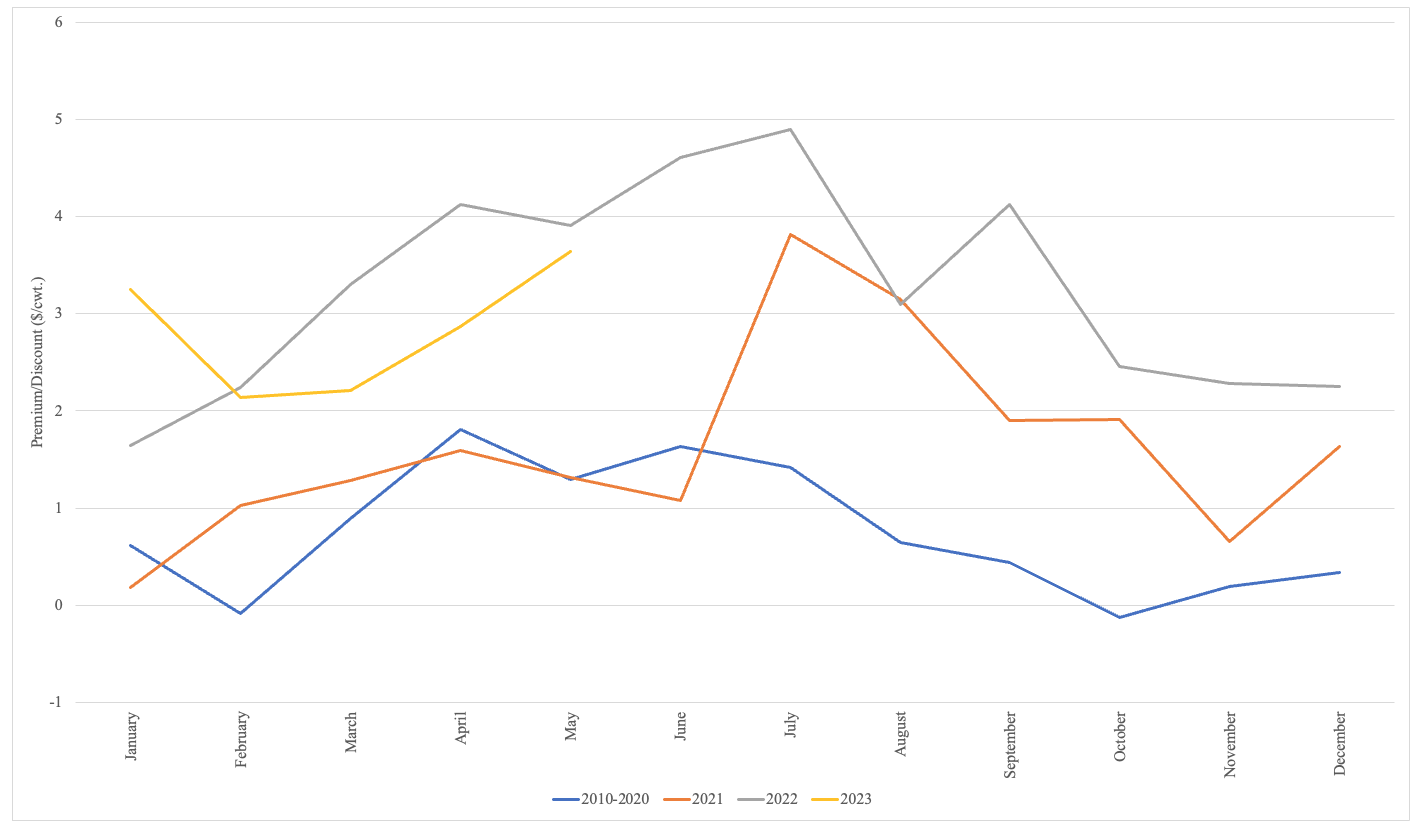
Do trucking premiums/discounts vary seasonally? Yes. Figure 2 shows the average implied trucking premiums/discounts for fed cattle from 2010-2020 and the yearly premiums/discounts for 2021, 2022, and 2023. Premiums tend to be the highest in the summer, peaking in July, and lowest in winter months, generally reaching their low in November/December.
Figure 2. Implied Fed Cattle Hauling Seasonality for Steers, 5-area Average, 2002-2023.
Regional differences
Do implied fed cattle hauling rates change by region? Yes. Table 1 shows the yearly premiums/discounts by region. Only two regions (Nebraska and Iowa/Minnesota) consistently report prices for both FOB and delivered cattle that are sold live or dressed. On average, prices are generally higher in Iowa/Minnesota than in Nebraska. The relative magnitude of these differences varies from year to year.
| - | Average of Weekly Premiums/Discounts ($/cwt.) in: | |||||
|---|---|---|---|---|---|---|
| - | Live | Dressed | ||||
| - | 5-area | Nebraska | Iowa/Minn. | 5-area | Nebraska | Iowa/Minn. |
| 2012 | 0.576 | 0.172 | 0.607 | 1.154 | 0.055 | 1.155 |
| 2013 | 1.003 | 0.648 | 0.964 | 1.589 | 1.094 | 1.479 |
| 2014 | 0.506 | -0.283 | 1.051 | 1.153 | 0.662 | 0.953 |
| 2015 | 0.786 | 0.498 | 1.302 | 1.391 | 0.608 | 1.461 |
| 2016 | -0.179 | 0.291 | 0.835 | 0.758 | 0.011 | 1.137 |
| 2017 | 1.013 | 0.107 | 1.024 | -0.120 | -0.452 | 0.161 |
| 2018 | 0.762 | 0.558 | 0.907 | 0.747 | 0.687 | 0.807 |
| 2019 | 1.920 | 0.890 | 1.250 | 0.589 | 0.213 | 1.211 |
| 2020 | 1.436 | 1.854 | 2.427 | 1.942 | 1.198 | 2.536 |
| 2021 | 1.630 | 1.168 | 1.250 | 1.329 | -0.034 | 1.489 |
| 2022 | 3.243 | 2.305 | 1.893 | -0.408 | -0.613 | 0.114 |
| 2023 | 2.844 | 2.570 | 1.520 | -0.994 | -1.830 | 0.097 |
| Avg. | 1.219 | 0.762 | 1.236 | 0.836 | 0.156 | 1.104 |
Strength and representativeness of implied trucking premiums/discounts
The strength and representativeness of these implied rates vary by the number of cattle reported in each separate price series and the number of regions contributing to each price series. Each week, the number of cattle sold, across all quality grades, is reported along with the weighted average price. Using these head counts by region and the 5-area average indicates which region is most represented in the index. There has historically been a large amount of volume and regional representativeness in the live-FOB and dressed-delivered prices. For example, the relative share of Iowa/Minnesota plus Nebraska has risen to approximately 60% for live-FOB but it varies considerably from week to week. However, on live-delivered and dressed-FOB Iowa/Minnesota and Nebraska account for about 90% of all transactions, on average. Thus, these implied trucking prices may be more representative of trucking prices ($/cwt.) in the northern plains than in other cattle-feeding regions.
Implications
These implied trucking premiums/discounts are not monetarily insignificant. Given rising cattle and carcass weights in the last 15 years, the relative value for trucking is much larger. A $5 per cwt. premium to deliver on a 1500 lb. steer would imply worth of $75 per head for trucking costs. A pot belly trailer can hold approximately 50,000 lbs. or 33 head of cattle (50,000/1500). Thus, the hauling of fed cattle would be worth $2,475 (75 x 33). While not evident in the data, feedlots closer to processing plants have lower transportation costs, and thus bids for cattle (FOB vs. delivered) likely affect the total price received for cattle.
Several issues have the current and future potential to impact the livestock hauling industry in the next several years. First, there has been a general move towards haulers wanting to be home at night and thus fewer willing to do long hauls. This changes the cost and thus economically viable range cattle can be transported. Second, there are relatively fewer individuals who want to haul livestock or other commodities anymore. This is seen by the fact that Walmart is willing to offer $100,000 plus bonuses and training to join their hauling team.
Of course, there are other factors affecting the salary, but that is quite a sustainable wage.
Where else can one get that wage relative to one's education and experience? Third, and likely the largest, electronic log devices (ELD) and the restriction on the length of time truckers can be on the road could limit the distance of hauling livestock. Thus far, agriculture has received exemptions conditional on the distance and frequency of these hauls. However, Canada and Texas have experienced increased regulation on animal hauling, potentially increasing the cost of transporting livestock. These, among other factors, are likely to impact the ease and cost of transporting livestock.
This article was first published by “In the Cattle Markets” on May 30, 2023.
