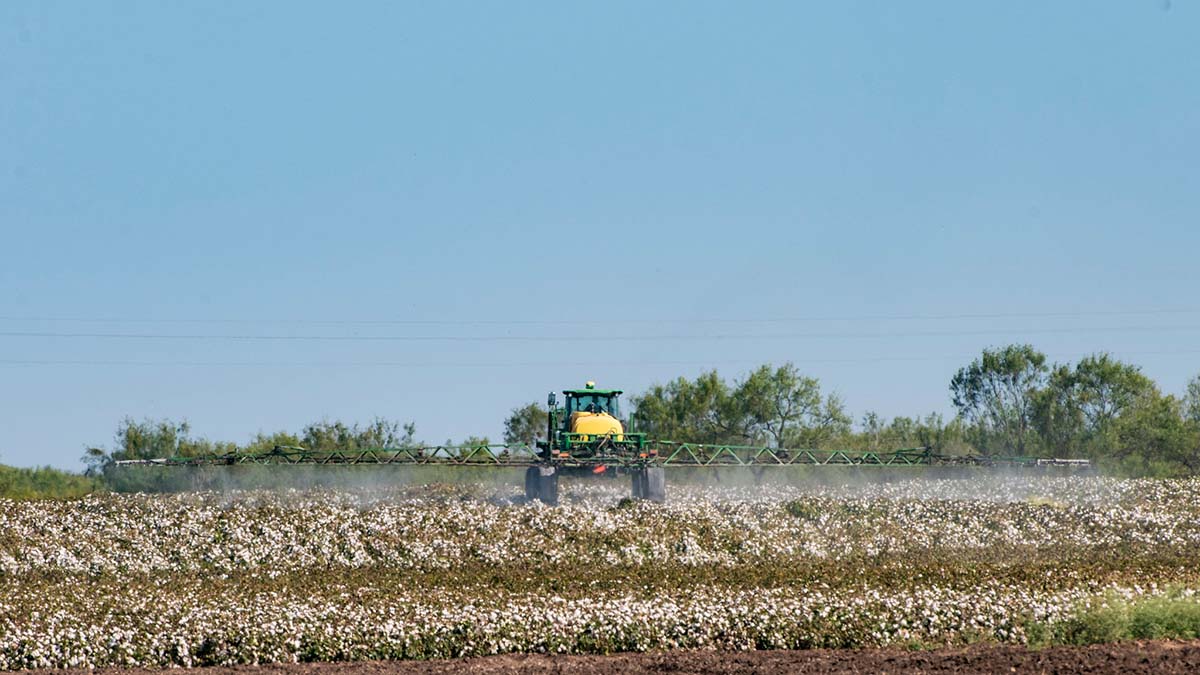
USDA/Flickr (Public Domain)
Listen: Nebraska FARMcast
Significant increases in the cost of fertilizer over the past year have caused a lot of concern and heartburn among farmers and ranchers in Nebraska. Given that fertilizer costs now account for approximately 15-20% of total cash costs for corn production in Nebraska, fertilizer prices and availability are a major concern for farmers planning for the 2022 growing season. Farmers in some areas are reporting prices more than 300% higher than last winter, and delivery times seems to be anyone’s guess. Veteran growers may recall a similar situation in 2007-2009 when prices for nitrogen, phosphate, and potash doubled, or more, from pre-2007 levels. That price increase was driven by strong demand (domestic and global), low fertilizer inventories, and very slow adjustments in production by the U.S. fertilizer industry. Those same factors, and more, are at play this time around; and the increased uncertainty may be cause for concern.
Because fertilizer is a global commodity, it can be influenced by various market factors beyond the control of U.S. producers. Nearly 45% of all fertilizer materials are exported to a different country from where they were produced. This means that fertilizer prices are more volatile than if produced and consumed in the same country, because they are affected by what is occurring where they are produced, the cost of production in that country, demand from other countries needing fertilizer products, and costs to transport fertilizers to their destination. Another confounding factor is that two-thirds of global fertilizer demand is driven primarily by six crops; and corn, wheat, and soybeans constitute about 36% of that total demand. So, as large producers of corn, soybeans, and wheat, the U.S. and Nebraska are large consumers of fertilizer.
Now on the supply side of the equation, the U.S. is the third-largest producer of fertilizer globally. However, because it consumes or demands so much to produce corn, wheat, and soybeans, among other crops, the U.S. is a net importer of all three nutrients, especially nitrogen and potash. This means that U.S. fertilizer dealers and U.S. producers pay the global market price for fertilizers, plus transportation costs.
To produce fertilizer, facilities use globally priced raw materials and substantial amounts of energy to convert the raw chemical materials into forms farmers can use. For example, anhydrous ammonia is produced by the Haber-Bosch process in which nitrogen is combined with hydrogen to synthesize the ammonia, using natural gas as the source of the hydrogen, as well as the energy, for synthesizing. Natural gas is an essential element for most nitrogen fertilizers, and accounts for 70% to 90% of the production variable costs in the synthesis process. So, natural gas prices have an outsized impact on nitrogen fertilizer prices. Because, natural gas prices have risen dramatically over the past few months, especially in Europe, it has forced many EU nitrogen plants to close. Because plants built for this process typically require three to five years to build, the long-run impact is that when a demand surge occurs, the response time to fulfill supply via an additional production facility will lag about three to five years at a significant price tag.
Closer to home, last February, during that freeze throughout much of the U.S. heartland, including Texas, much of the natural gas production was interrupted or shifted away from industrial uses and pushed to heating homes. This caused U.S. ammonia plants in Oklahoma, Texas, and Louisiana, which combined account for about 60% of production, to shut down during this time and cut about 250,000 tons of production. Then Hurricane Ida hit the Gulf Coast and production stopped once again.
COVID-19, of course played a role in plant production disruptions, either for much-needed regular maintenance or issues that have occurred because of delayed maintenance. These disruptions caused a slight decrease in availability, despite the U.S. spending the past few years increasing its number of production plants. These disruptions are echoed throughout the supply chain, and across the global, as this is a global market. Compounding the supply situation was the real and forecasted conditions for commodities, and by extension fertilizers in 2019-2020. The pessimism before the pandemic began, combined with the uncertainty at the beginning of the pandemic, caused lower forecasts for fertilizers and firms responded by to cut back on production. The narrowing of fertilizer demand followed by a quick expansion, rather than a slow return, created another supply chain shock. The rapid rise in row crop prices led to quick reactions for higher fertilizer demand in the U.S. and abroad, further tightening supplies already strained due to production and distribution issues.
Increased transport costs, from higher fuel costs and trucking rates have caused prices for materials like fertilizers to increase as well. Increased volume of goods shipped at all stages have positively impacted prices too. Hurricanes, ice storms, labor issues, additional manufacturing capacity and infrastructure breakdowns, including rail logistics issues and increased freight rates, have caused even more production and distribution disruptions.
Trades disputes and disruptions have played a big role in fertilizer availability and cost. The U.S. and EU have applied sanctions to Belarus — who contributes about 20% of global potash exports. This has slowed and even stopped shipments of potash to the EU and the U.S. and discouraged other countries from buying from Belarus — reducing global potash supply. At the end of September, China applied an export ban on phosphate due to rising costs of production and domestic use. Because China accounts for 25% of phosphate fertilizer exports globally, this export ban reduces global supply and puts upward pressure on prices. China may also restrict exports of urea, of which it contributes about 10% of global exports. And the uncertainty of Russian actions against Ukraine creates volatility in the markets for raw materials and finished goods in the fertilizer sector. Russia is a major exporter of natural gas to the EU and one of the top exporters globally of all three fertilizer nutrients — nitrogen, phosphate, and potash.
While this background material helps famers understand the factors driving fertilizer prices upward, it does not help them control these rising input costs. For this, growers need to focus on traditional approaches or tools to manage inputs and costs, so that they optimize their cropping enterprises from an economic perspective. Using a program like the Ag Budget Calculator (ABC) program, developed by University of Nebraska-Lincoln faculty at the Center for Agricultural Profitability (CAP), producers can determine their per-unit costs and better manage these costs by manipulating input levels, if the know the impacts on production or anticipated output. By knowing their production costs, the ABC program helps growers determine their break-even costs on a per-unit basis. This helps growers know how much they must receive for a bushel of corn, for example, to cover their cash or economic costs. This information goes a long way toward growers knowing the price they can lock in or target through various marketing strategies and tools so that they make the most profitable choices available. For more information on the ABC program, and training opportunities for that program, go to: https://cap.unl.edu/abc. To download nitrogen calculators, visit the University of Nebraska-Lincoln's CropWatch site at http://cropwatch.unl.edu/soils.