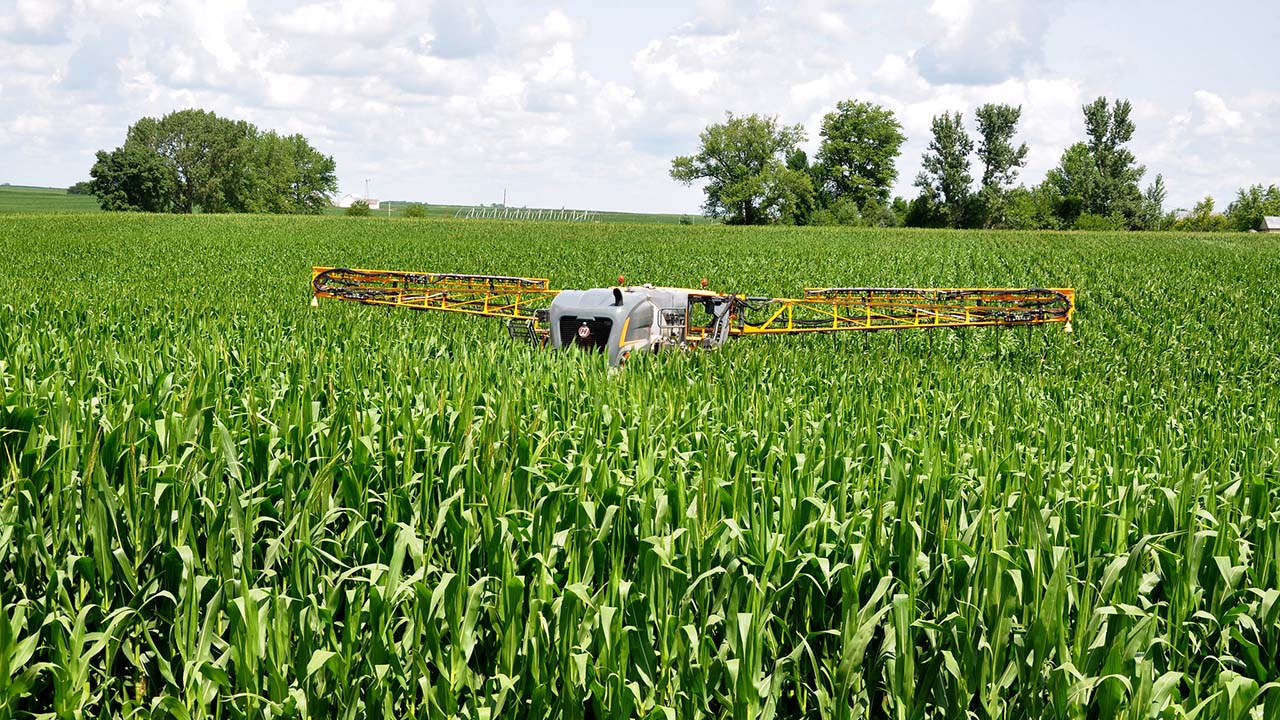
Jason Johnson, Iowa NRCS (Flickr)
Listen: Nebraska FARMcast
This article was first published in the October 2021 Tips for Taps series.
Brief: Nitrogen costs were already high throughout the 2020 production season, yet the market size is predicted to continue growth. The global Industrial Nitrogen Market was sized at $14 billion 330 million in 2020 and is anticipated to be at a worth of $20 billion 410 million by 2027, with a Compound Annual Growth Rate (CAGR) of 4.7% during this time frame (Industry Research Biz, 2021, p.1). With nitrogen prices predicted to continue increase in the coming years, now is a great time for producers to work on their fertilizer use regime.
Recently, specialists at the University of Illinois at Urbana-Champaign conducted a study of historical USDA index values on prices paid for fertilizer from 1990 to 2021, which exhibited nitrogen fertilizer prices trending upward in conjunction with increased consumer demand for energy. The highest recorded price during the examined timeframe, 2008, is a period of unparalleled index values for fertilizer. This, then, is directly attributed to “rising demand in emerging markets and long-term supply concerns,” (Schnitkey et al., 2021, pp.1-2). Of course, with the financial crisis in the same year, commodity prices consequently fell afterward, creating a financially difficult situation for agricultural producers. Now, however, the nitrogen index value is again trending upward; hopefully, crop prices will remain higher. The study conducted by Schnitkey et al., (2021), revealed that fertilizer prices were $746 per ton for anhydrous ammonia, $717 per ton for Diammonium Phosphate (DAP), and $600 per ton for potash on July 29, 2021, which were considerably higher values than in 2020 at the same time (p.2). In the breadth of a year, anhydrous ammonia increased by 53%, $487 per ton in 2020 to $746 per ton in 2021; DAP increased by 83%, $390 per ton in 2020 to $717 per ton in 2021, which is its highest price since 2008; and potash increased by 71%, $350 per ton in 2020 to $600 per ton in 2021 (Schnitkey et al., 2021, pp.2-3). Prices are likely to stay high, given the strong demand for and cost of energy resources.
University of Illinois researchers included that their three highest observed prices for anhydrous ammonia, ($848 per ton in 2009, $845 per ton in 2012, and $875 per ton in 2013), resulted in operational fertilizer costs of $185 per acre for corn and $62 per acre for soybean production in 2009, $200 per acre for corn and $68 per acre for soybean production in 2012, and $193 per acre for corn and $65 per acre for soybean production in 2013 (Schnitkey et al., 2021, p.4). For relevance, Illinois is now predicting “above-average fertilizer costs for 2022. The 2022 corn and soybean budgets for high-productivity farmland currently have values at $193 per acre for corn and $63 per acre for soybeans,” (Schnitkey et al., 2021, p.5). According to Ag Valley Co-Op, headquartered in Edison, Nebr., Urea-Ammonium Nitrate (UAN) fertilizer prices quoted to area producers at this time last year have now seen close to a 200% value increase compared to current 2021 levels. Based on historical context around the highest-recorded prices, producers will want to be aware of elevating consumer demand for energy and consequential nitrogen fertilizer pricing impacts in 2022.
References:
Industry Research Biz. (2021, Sept. 21). Industrial nitrogen market size forecast 2021 to 2027 - Top key vendors analysis, growing demand, professional and technical industry vision, consumption and revenue research report. The Express Wire. https://www.theexpresswire.com/pressrelease/.
Schnitkey, G., Paulson, N., Zulauf, C., & Swanson, K. (2021, Aug. 3). Weekly farm economics: 2021 fertilizer price increases in perspective, with implications for 2022 costs. Farmdoc Daily, 11(114), Dept. of Agricultural and Consumer Economics, University of Illinois at Urbana-Champaign. https://farmdocdaily.illinois.edu/2021.
Analysis: Rising nitrogen fertilizer costs & using the difference between maximum profit and maximum productivity
The current energy cost trends predict a continued increase of nitrogen fertilizer prices. There is likely no better time for fertilizer users to recognize and adjust use to maximize profit. Figure 1 was developed using the TAPS 2018 data; as expected, Nitrogen (N) fertilizer use plateaued in its effect in increasing productivity, in fact the figure shows that once reaching a peak, productivity declines with additional fertilizer. This relationship is known as diminishing return. If this wasn’t so, it would be possible to feed the world with a single acre of land, simply by increasing fertilizer levels. Once we know the physical relationship between applied N and yield, we can use both N costs and crop prices to estimate the economically optimal amount of applied N. Let’s use the data from the 2018 TAPS contest and walk through the thinking and mechanics of N decision-making.
In the TAPS sprinkler corn contest, both the timing and quantity of N comprise one of the six decision types made by competitors throughout the growing season, just as producers manage on their own operations. There are other benefits to using appropriate amount of N fertilizer besides working toward a greater amount of profit. The over-application of N gets into groundwater and nearby waterways, thus becoming a pollutant. Excessive use does little or nothing to increase revenue but inflates costs. The difficulty of determining the “right” amount of N to use is knowledge of yield responses, as well as available quantities of the nutrient. Like many natural processes, at some level N exhibits a diminishing marginal effect. There comes a point at which the next added unit returns less than the previously applied unit. From the TAPS sprinkler irrigated corn contests for 2017, 2018, and 2019, this relationship was estimated using a statistical model, (i.e., OLS regression). Looking at Table 1, the 2017 base yield without any application of fertilizer or the addition of irrigation is 140.31 bu/ac. Ignoring the estimated diminishing effect, (estimated to -0.001 for every additional pound of N/acre2,) on average, each added pound of N/ac increased bu/ac of corn by 0.471. Averagely, 2018 had 13.23 bu/ac more than 2017, and 2019 had 30.34 bu/ac less. Each added inch of irrigated water increased yield by 7.69 bu/ac.
| 95% | N Fertilizer | lbs of N/Acre | lbs of N/Acre Squared | Yr 2019 | Yr 2018 | Inches of Irrigation |
|---|---|---|---|---|---|---|
| Variable Estimates | 140.31 | 0.471 | -0.001 | -30.34 | 13.23 | 7.69 |
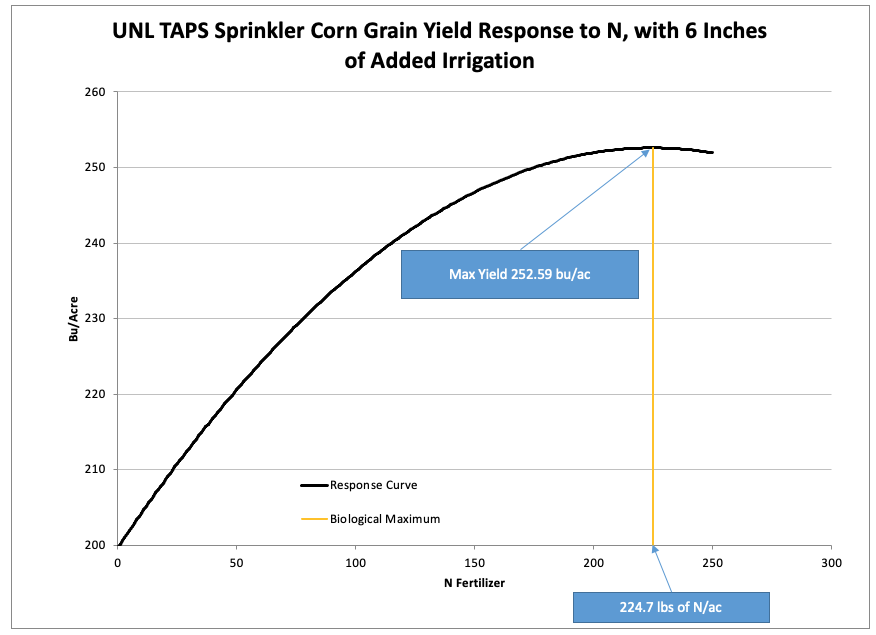
Using this information, we created a graphic. Figure 1 is one way to visually see and identify the production relationship between N and corn yield and is referred to as a yield response curve. Noticeably, adding more than 224.7 lbs/ac of N would decrease productivity. From the figure, the curve starts out with about a 45-degree slope and slowly flattens out, as more and more N is applied, until finally it has no slope, and the maximum yield is reached. The point where there is no slope, a slope of zero, indicates that the further addition of N has no effect on yield. Instead, application of N fertilizer after this point is reached has a negative effect on yields. The take home is to recognize what the shape of the yield response curve means, which indicates that the lower levels of applied N/ac have greater responses than the higher levels of application.
Figure 1. Yield Response to N fertilizer application for 2017, 6 inches of added irrigation.
It is important to visualize what diminishing returns look like and also what that really means for deciding an optimal amount of fertilizer to apply. Moving to Table 2, three different types of values are captured that can help us begin to understand the true relationship between yield and applying N fertilizer. The first column in the table shows the amount of N fertilizer applied, column two shows the forecasted yields indicated by the statistical model listed in Table 1, and column three contains the amount of yield per bushel that the model predicts will be produced by the addition of one pound of N. The addition of 10 lb/ac of N expects a yield of 204.273 bu/ac and the addition of the 10th pound of N/ac increased corn grain yield by 0.451 bu/ac. Moving down the table to 50 lb/ac of N, yield increases to 220.597 bu/ac, and the contribution of the 50th lb of N/ac sees 0.367 bu/ac, which is a little less than a 20% decline. Adding 100 lb of N/ac predicts a yield of 236.286 bu/ac, and the 100th lb of N/ac increased yield by 0.262 bu/ac. This type of evaluation, where the effect of the next singular unit is considered, is known as a marginal analysis. Using this marginal methodology, it is pretty straightforward to find the optimal level of N fertilization using productivity, costs, and revenue.
In this instance, marginal analysis asks does the last unit of input, N fertilizer, create enough productivity and/or revenue to pay for its use? This is achieved when Marginal Cost (MC) equals Marginal Revenue (MR). MC is the cost of adding the next unit of input, in this case one pound of N fertilizer. MR is the value of the bushels of corn grain produced as a direct result of using that added pound of N fertilizer. Using the information in the creation of Figure 1, N fertilizer costs and corn bushel marginal values can be calculated. Starting with the 50 lbs of N/ac level of application, we see from Table 2 that 0.365 bushels will be produced with the addition of the next pound of N, going from 50 lbs of N/ac to 51 lbs. If N fertilizer cost $0.61/lb, the MC is $0.61/lb of N. The MR is simply the value of the added production, 0.365, times the expected average value of the corn grain. For convenience, we use $3.50/bu value. Using these values, the MR is equal to $1.29/lb of N. If prices were much higher, say $5.75/bu, the MR would be adjusted accordingly and would calculate much higher at $2.11.
| N/ac | Forecast Yield Response | (MR) Marginal Revenue/lb of N | ||
|---|---|---|---|---|
| lbs of N applied per acre | Yield (bu/ac) | bu for the next lb of N (marginal production) | @ $3.50/bu corn | @ $5.75/bu corn |
| 10 | 204.27 | 0.451 | $ 1.58 | $ 2.59 |
| 11 | 204.72 | 0.449 | $ 1.57 | $ 2.58 |
| | | | | |||
| 50 | 220.59 | 0.367 | $ 1.29 | $ 2.11 |
| 51 | 220.96 | 0.365 | $ 1.28 | $ 2.10 |
| | | | | |||
| 100 | 236.28 | 0.262 | $ 0.92 | $ 1.51 |
| 101 | 236.54 | 0.260 | $ 0.91 | $ 1.50 |
| | | | | |||
| 220 | 252.56 | 0.011 | $ 0.04 | $ 0.06 |
| 221 | 252.57 | 0.009 | $ 0.03 | $ 0.05 |
From this outcome, it is obvious that MR is much higher than MC. When revenue or return is higher than costs or input, it makes sense to use more fertilizer. In the case where MC is greater than MR, however, less fertilizer should be used since the added cost of the fertilizer exceeds the value of the increased production. For example, at 221 lbs of N, about 4 lbs shy of the biological optimum, we find the MC remains unchanged at $0.61/lb, but MR is around $0.03/lb of N for $3.50/bu and about $0.05/lb of N for $5.75/bu corn grain. This tells us that at 221 lb of N/ac, the last pound of N applied returns much less than it costs, making this level of fertilization not optimal. From this table, it is clear that the economically optimal N fertilization rate for these three years of TAPS was between 101 and 200 lbs of N/ac. Remember our rule that the best we can do is equate MC with MR. Since MC is simply the cost of applying N fertilizer and it is a constant value of $0.61/lb, we need to find the MR value that is equal to this value. Without further belaboring of the point, we found the optimal level of fertilization to be 148 lbs of N/ac for $3.50/bu valued corn and 175 lbs of N for the $5.75/bu corn price. Furthermore, we also found the optimal rate of N fertilization for $0.30/lb of N for the same two corn prices, see Table 3.
| $/bu | $/bu | |||||
|---|---|---|---|---|---|---|
| Low Corn Price, $3.50 | High Corn Price, $5.75 | Difference in N fertilizer lbs due to corn prices | ||||
| N Fertilizer Costs | bu/ac | N lb/ac | bu/ac | N lb/ac | ||
| High Price, N, $0.61/lb | 247 | 148 | 250 | 175 | 27 | N lb/ac |
| Low Price, N, $0.30/lb | 251 | 183 | 252 | 199 | 16 | N lb/ac |
| Difference in N fertilizer lbs due to fertilizer costs | 35 | N lb/ac | 24 | N lb/ac | ||
Using the response function, and representative prices and costs, the economically “right” amount of N to apply can be determined and is the basis for the following discussion. Remember that each farm/field has its own response function, level of fertility, and environmental conditions. In this case, we are only considering the effect of N and assume all other factors are at a fixed level. From Figure 1 and Table 2, it is evidenced that adding N/ac creates bushels of corn, and that response is affected by the current level of fertility. Using marginal analysis, we have discovered that the optimal level of production is where cost and returns are equal, (MC = MR). We have shown that the rational decision to use fertilizer requires that each additional lb of N applied should produce adequate bushels, so as to at least pay for the use of the fertilizer, meaning that the cost of the fertilizer and the value of the corn both impact the economic profit level of fertilization.
The rule of thumb we refer to says that you get about half a bushel of corn grain for every lb of N applied. If we use this rule, then the average value of each lb of N, based on $3.50/bu corn price, is $1.75/lb of N. Comparing this with the average costs of applying N, $0.61/lb of N, it seems the fertilizer more than paid for itself. Don’t be fooled – the averages are hiding the truth and demonstrate why marginal analysis is so valuable. Using the response equation found in Table 1, at 225 lbs of N/ac, the expected yield is 252.58 bu/ac. This is very close to our rule of thumb, so we assume the best we can produce is 253 bu/ac. If we use the idea of average returns and that additional N does not decrease yield, how many lbs of N could we theoretically afford to apply? This would be where the costs of the average production of the fertilizer equals the average value of the fertilizer. If we believed that our best yield is at 253 bu/ac, we could afford to apply about 371 lbs of N/ac. That’s a boat load of N. No one would do this since applying less would result in the same yield, but it does illustrate the fallacy of averages. The fallacy of averages does not exist when there is no diminishing effect of an input, as the first unit has the same effect as the last unit applied. Any time one decides based on an average outcome, they are forgoing the cumulative effect of the input. For some inputs, the marginal difference is easy to know. This is often the case for the application of an insecticide. If I spray the “Best Spray Ever” it costs X dollars/ac and I get an estimated Y amount of benefit/ac. Rational thought indicates that one would only spray when the benefits exceed or equal the costs. Notably, part of the benefit might include intangibles, exposure to risk, feelings, etc.
Please note that the marginal approach is consistent with the precision agricultural concept, while the other is more attune to one size fits all. It is expected that marginal analysis will be dominant in all the algorithms for recommendations based on its relationship to yield. From Table 4, low value corn with high fertilizer cost is the largest difference, which shows a quite significant 26.51/ac increase in profit by using the marginal analysis approach. The least increase in profit/ac is high value corn and low-cost fertilizer. Table 4 extrapolates that the higher the value of corn, the smaller dollar impact the marginal analysis has on profit. This should come as a shock since the higher corn price would increase N application, which would increase yield (revenue), and reduce savings from N application.
The four possible scenarios found in Tables 3 and 4 for corn and fertilizer prices are: 1) Low corn value and high N costs, 2) Low corn value and low N costs, 3) High corn value and high N costs, and 4) High corn value and low N costs. From a historical perspective, the one most likely to dominate the future is scenario 1. As an industry, it isn’t likely that farming will become less competitive, nor that the use of inputs becomes less scrutinized or less regulated. It seems that the logical way forward is to begin identifying the true relationships of inputs to productivity, and then make decisions based on that productivity and the realities of the marketplace, both input and output.
| Low Corn Price, $3.50/bu | High Corn Price, $5.75/bu | |||
|---|---|---|---|---|
| N Fertilizer Costs | bu/ac lost | N/ac Saved | bu/ac lost | N/ac Saved |
| High Price, N, $0.61/lb | 5.8 | 77.0 | 2.596 | 50 |
| Low Price, N, $0.30/lb | 1.8 | 42.0 | 0.696 | 26 |
| $/ac lost or gained due to yield loss and N savings | ||||
| High Price, N, $0.61/lb | -$20.46 | $46.97 | -$14.92 | $30.50 |
| Low Price, N, $0.30/lb | -$6.39 | $12.60 | -$4.00 | $7.80 |
| Profit Change/ac | ||||
| High Price, N, $0.61/lb | $26.51 | $15.58 | ||
| Low Price, N, $0.30/lb | $6.21 | $3.80 | ||
From this case study and thanks to the TAPS data, several facts have been reinforced and are becoming ever more apparent. First, having individual area N response functions would enable the implementation of precision farming. Second, having N response functions for individual areas and/or fields would save applying excessive N fertilizer that returns farmers no money and may become a contaminant in the local ground or surface water, consequentially increasing the likelihood for future regulation. Thirdly, low commodity prices call for the use of less N than high prices, and N expense and corn price play a role in the economically optimal quantity of N to be applied.