USDA/Flickr
Listen: Nebraska FARMcast
Upcoming Webinar
Fertilizer Cost Increases, Projected Cost of Production and Navigating a Riskier Financial Environment
Nov. 18, noon CST
RegisterBackground
World prices for phosphorus and nitrogen fertilizers reached low levels in early 2020 and have been increasing sharply to reach levels not seen since 2008 (see Figure 1). Futures prices for these fertilizers for November delivery are even higher, above $700/mt. Potassium fertilizer prices remain low internationally but have reached much higher levels in the Corn Belt region and Brazil. The World Bank reports a 66% increase in fertilizer prices in 2021 in its commodity outlook and anticipates potassium fertilizer prices to sharply increase in 2022. What explains these steep increases in most fertilizer prices? In short, a perfect storm of supply shocks, weather events, plant closures, imperfectly-competitive and shallow market structure, and a series of policy changes has been brewing and is now culminating into concerning price volatility and deterioration in fertilizer affordability. We review these various elements in turn.
Figure 1. Nominal fertilizer prices (DAP (diammonium phosphate), spot, f.o.b. U.S. Gulf; TSP (triple superphosphate), spot, import U.S. Gulf; Urea, (Ukraine), f.o.b. Black Sea; Potassium chloride (muriate of potash), f.o.b. Vancouver)
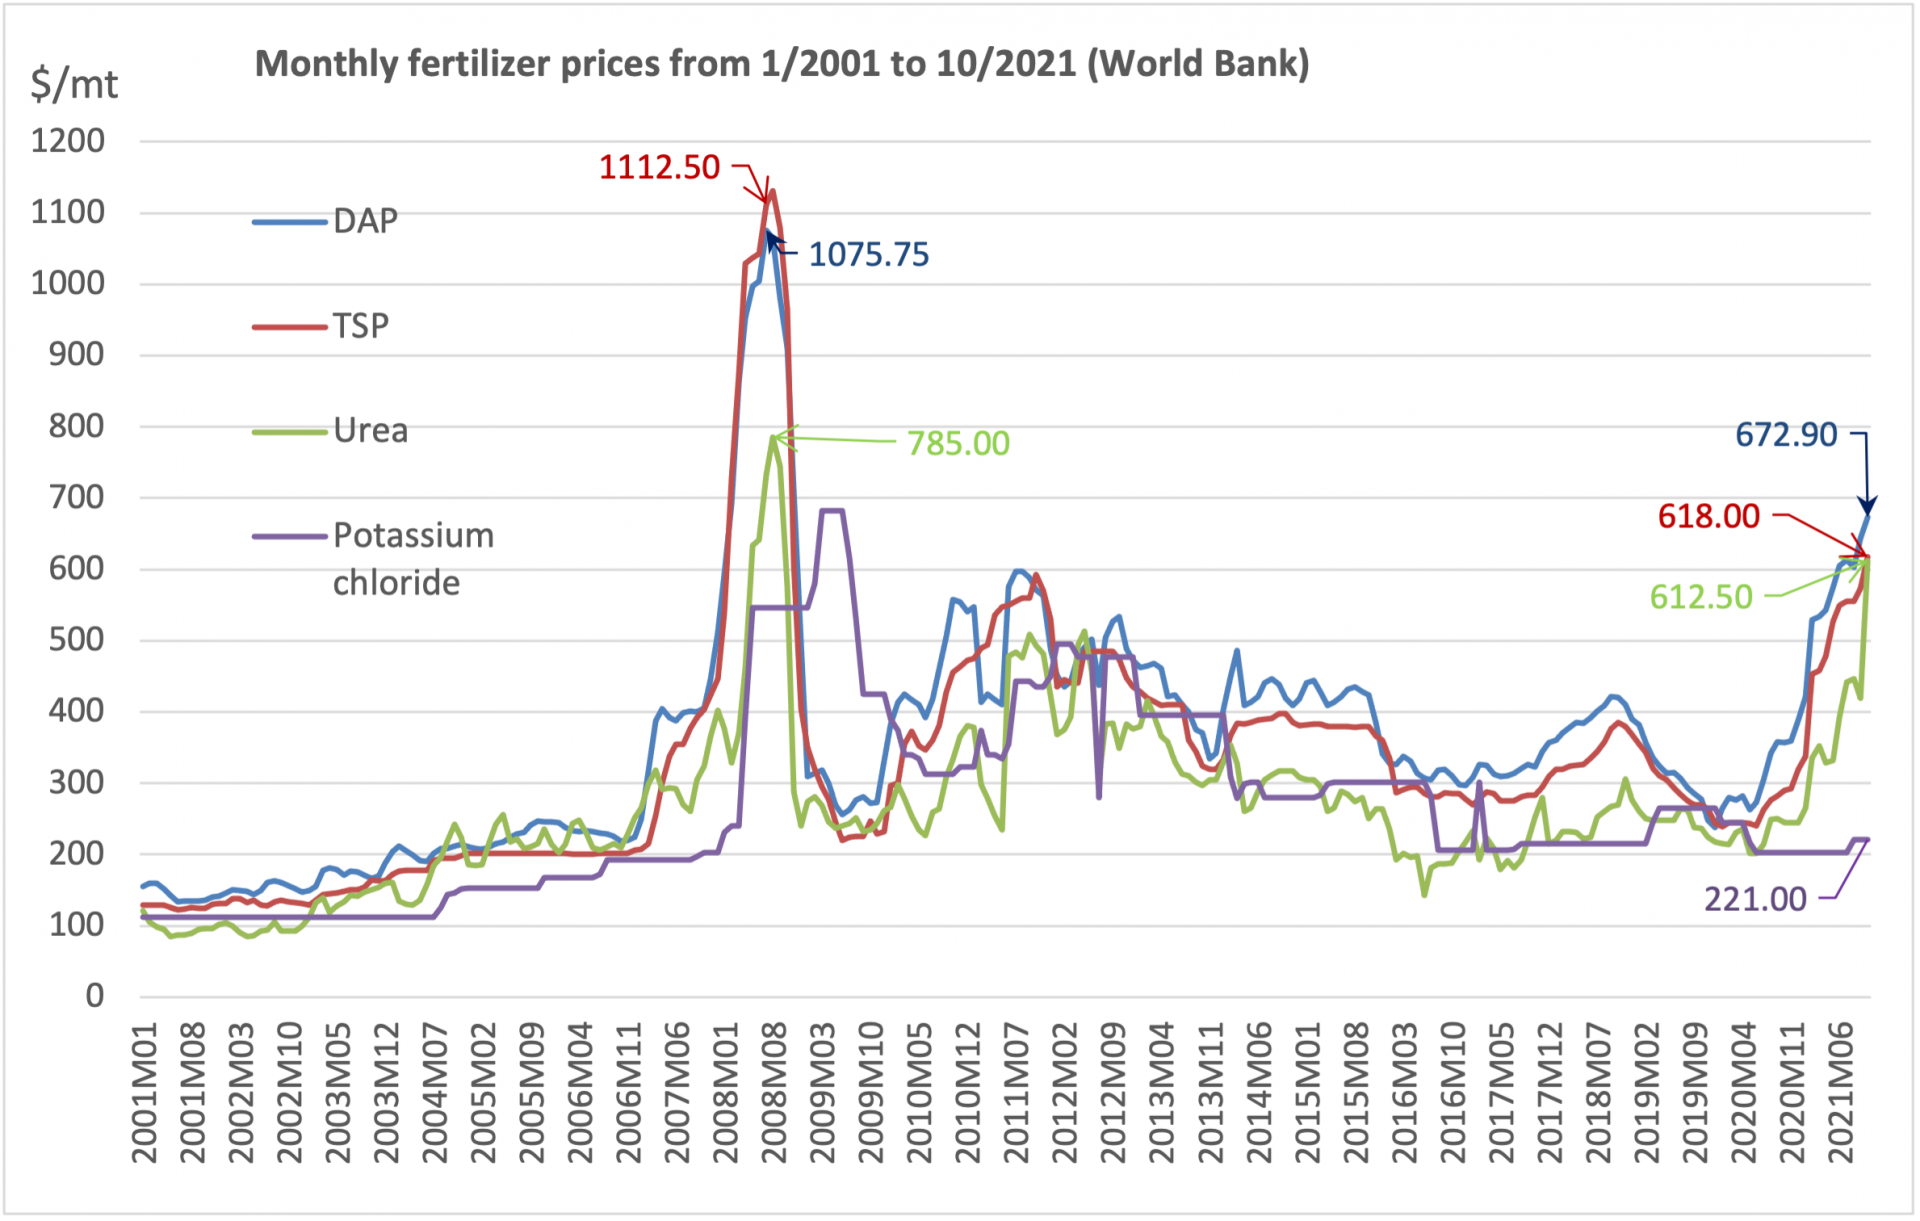
Figure 1. Nominal fertilizer prices (DAP (diammonium phosphate), spot, f.o.b. U.S. Gulf; TSP (triple superphosphate), spot, import U.S. Gulf; Urea, (Ukraine), f.o.b. Black Sea; Potassium chloride (muriate of potash), f.o.b. Vancouver)
Worldwide supply disruptions
Fertilizer markets are characterized by having a few very large players with outsized presence and influence on these markets and prices (see Appendix Table 1 for recent data). World supply of fertilizer has been curtailed with output and supply decreases in Europe, China and even Russia caused by sharp increases in production costs. Specifically, prices of natural gas and ammonia in Europe and Russia, and in China, high prices for coal created electricity shortfalls and disruptions in the energy intensive fertilizer industry. These supply difficulties pushed the Chinese government to put export restrictions in place, likely to last well into 2022. Russia also placed restrictions on exports to keep domestic fertilizer costs down as higher fossil energy prices increased cost of production. In the U.S., hurricane Ida induced some plant closings in the southeast. These U.S. supply disruptions are temporary, but they exacerbated existing logistic issues in markets. Fertilizers are differentiated by type of application and timing in the growing season and availability is a key attribute of supply which can induce scarcity. The increase in fossil fuel prices induced by the 2021 economic recovery and anti-fossil policies in many OECD countries is a fundamental factor which fed into ammonium prices and energy-intensive fertilizer production.
Strong demand for fertilizers
During the pandemic, fertilizers were affordable as they were inexpensive, relative to crop prices. Higher commodity prices for major crops in the first half of this year kept affordability of fertilizer below its long-term average (see Figure 2 exhibiting the ratio of indices for fertilizer prices and grain prices). A higher number means that affordability is deteriorating. This period of relative inexpensive fertilizer relative to crop prices led to strong demand for fertilizers in the U.S., Brazil and China. The latter has had strong feed demand rebuilding its hog herd. Affordability has substantially decreased since the end of 2020 but remained below the long-term average until July 2021 thanks to high commodity prices in the first half of the year. Since then, it has continued to deteriorate, well above its long term average of 0.96, while staying within historical range, as shown in Figure 2.
Figure 2. Fertilizer affordability (fertilizer price index /grains price index) from The World Bank Pink Sheet (November 2021). The indices combine natural phosphate rock, phosphate, potassium, and nitrogenous; for grains, rice corn wheat, and barley.
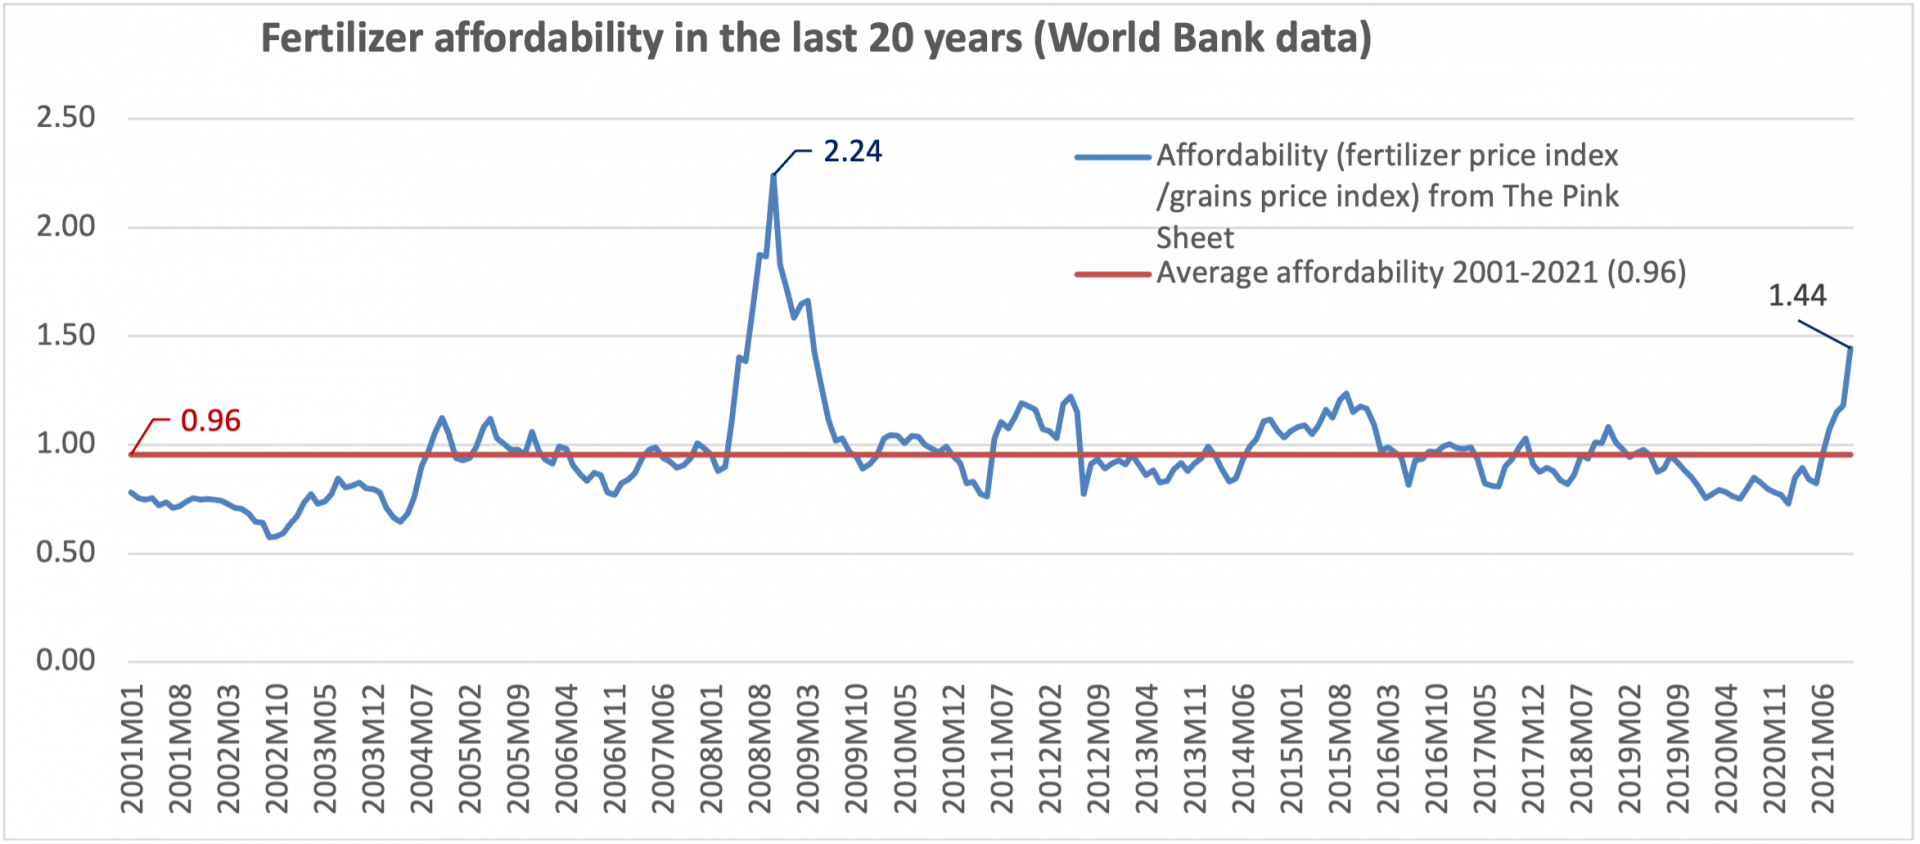
Figure 2. Fertilizer affordability (fertilizer price index /grains price index) from The World Bank Pink Sheet (November 2021). The indices combine natural phosphate rock, phosphate, potassium, and nitrogenous; for grains, rice corn wheat, and barley
Policies
Although the U.S. has Most-Favored-Nation (MFN) tariffs set to zero on all fertilizers, a series of policies since 2010 have been affecting the cost and sourcing of fertilizers in the U.S. The U.S. has been slapping tariffs on fertilizer products from China since 2010 on with several anti-dumping and countervailing duties (AD-CVDs) initiated by the Department of Commerce (DoC) and the U.S. International Trade Commission (USITC). These duties have been prohibitive in the sense of having curtailed most of the sourcing from China, which is the world largest producer and exporter of nitrogen and phosphate fertilizers. As an overkill sort of way, section-301 duties of 10% then 25% were imposed on most fertilizers from China in 2017. These were largely imposed for policy signaling as these trade flows had been eliminated by the AD-CVD duties already in place.
More recently in 2020-21, a DoC-USITC investigation has led to AD-CVD duties imposed on phosphate fertilizer imports from Russia (varying AVE duties from 9.19% to 47.05%) and Morocco (19.97% duties). As shown in Appendix Table 2, these duties have shut down Morocco as a source of phosphate fertilizer in 2021 (see under the HS 3105 column in Appendix Table 2) and for the foreseeable future; they have reduced imports from Russia as well. Even more recently, DoC and USITC have investigated nitrogen fertilizer imports from Russia and Trinidad and Tobago. They have concluded that these imports were sold at unfair prices and had been subsidized by their respective governments. Duties are not yet in place but initial estimates by DoC indicate alleged dumping margins of 158.81% from Trinidad and Tobago and 169.96 to 391.65% for imports sourced in Russia. These duties when in place will shut down these sources of nitrogen imports for U.S. farmers. DoC-USITC decisions are often controversial and politically motivated with a frequent strong protectionist bias in its methodology to compute dumping margins.
While these traded quantities will eventually find new markets and, as U.S. farmers will learn to source fertilizers in other countries than China, Morocco, Russia and Trinidad and Tobago, trade and markets will reorganize but with added cost to establish new trade flows and establish the associated logistics. The problem is compounded by the lopsided fertilizer market. The elimination of China, Russia and Morocco knocks off the largest sources of nitrogen and phosphate fertilizer in world markets (see Appendix Table 1). The remaining sources are much smaller. For phosphate fertilizers, the Middle East has been the major benefiter of these policies, especially Saudi Arabia, Israel, Jordan and Qatar, as shown by Appendix Table 2. For now, potassium fertilizer trade seems less uncertain as Canada is the primary source of U.S. imports (see Appendix Table 2 for detailed bilateral imports by the U.S.).
Transportation and logistics and COVID aftermath
Following the pandemic recession, a shortage of drivers, port personnel and other disruptions in transportations with backlogs have also impacted the fertilizer market. The time aspect of fertilizer is important given the specialization in fertilizer type and application during the crop year. The case of potassium prices illustrates dramatically the lack of price arbitrage and high cost of logistics to deliver fertilizers (local prices above $700/mt and world price below $250/mt). The price of potassium fertilizer in the Midwest is extremely high because of sanctions by the EU, UK, U.S. and Canada on Belarus exports. Belarus is a major source of Potassium. In addition, hurricane Ida created disruptions and increases in barge shipping costs, compounding the price increase for potassium fertilizers.
The outlook
The World Bank in its October 2021 outlook does not expect nitrogen and phosphate fertilizer prices to keep climbing. Potassium prices are expected to climb dramatically. Eventually, supply disruptions and transportation issues will subside and new trade patterns will be established, but these will take time and additional resources. Energy policies aiming to curb fossil fuels will keep energy prices — and, hence, fertilizer prices — high unless a reality check will induce a policy correction.
Appendices
Appendix Table 1. World production, use, and trade of fertilizers (FAOSTAT)
| Fertilizer production (2019) | |
| Top N producers by volume in metric tons | |
| China | 32,529,245 |
| India | 13,722,200 |
| United States of America | 13,261,507 |
| Russian Federation | 10,913,200 |
| Egypt | 4,200,000 |
| Top P producers by volume in metric tons | |
| China | 13,277,276 |
| India | 4,790,700 |
| United States of America | 4,600,400 |
| Russian Federation | 4,115,200 |
| Morocco | 3,715,400 |
| Top K producers by volume in metric tons | |
| Canada | 12,179,400 |
| Russian Federation | 8,675,000 |
| Belarus | 7,348,293 |
| China | 6,145,883 |
| Germany | 2,413,966 |
| Fertilizer agricultural use | |
| Top 5 N Fertilizer use in metric tons | |
| China | 26,872,810 |
| India | 18,863,900 |
| United States of America | 11,672,412 |
| Brazil | 4,911,744 |
| Pakistan | 3,505,356 |
| Top 5 P Fertilizer use in metric tons | |
| China | 10,330,187 |
| India | 7,464,800 |
| Brazil | 4,860,258 |
| United States of America | 3,973,510 |
| Pakistan | 1,099,707 |
| Top 5 K Fertilizer use in metric tons | |
| China | 10,350,430 |
| Brazil | 6,774,144 |
| United States of America | 4,304,636 |
| India | 2,640,900 |
| Indonesia | 1,732,599 |
| Fertilizer trade | |
| Top 5 importers of N fertilizer in metric tons | |
| India | 6,529,953 |
| Brazil | 4,880,692 |
| United States of America | 4,088,223 |
| France | 1,940,314 |
| Turkey | 1,694,105 |
| Top 5 importers of P fertilizer in metric tons | |
| Brazil | 3,493,348 |
| India | 2,918,129 |
| United States of America | 1,678,317 |
| Canada | 929,766 |
| Australia | 711,586 |
| Top 5 importers of K fertilizer in metric tons | |
| United States of America | 7,008,527 |
| Brazil | 6,560,351 |
| China | 5,977,190 |
| India | 2,653,475 |
| Indonesia | 1,740,134 |
| Top 5 exporters of N fertilizer in metric tons | |
| Russian Federation | 7,188,073 |
| China | 6,061,171 |
| Qatar | 2,358,102 |
| Saudi Arabia | 2,146,452 |
| Egypt | 2,118,973 |
| Top 5 exports of P fertilizer in metric tons | |
| China | 5,350,889 |
| Morocco | 3,854,297 |
| Russian Federation | 2,952,178 |
| United States of America | 2,181,368 |
| Saudi Arabia | 2,058,113 |
| Top 5 exports of K fertilizer in metric tons | |
| Canada | 11,742,366 |
| Russian Federation | 6,467,962 |
| Belarus | 6,318,818 |
| Germany | 2,162,635 |
| Israel | 2,052,263 |
Appendix on bilateral trade patterns stylized facts on trade and changes since 2018
Discussion: We note the concentrated sourcing for most fertilizers. The top 10 sources explain most of the sourcing. China has now a minor role because of tariffs and AD-CVD in place and despite being a large (among largest) producer and exporter of N and P fertilizers. Canada is a major source for N, K, and others but lost about $380 million in 2021 compared to 2018. Russia is a top source for N, K, and combinations still in 2021 but lost $90 million. The forthcoming impact of AD-CVD duties on N fertilizers are not reflected yet in these trade data. The share of Russia is likely to be reduced to negligible in 2022. Morocco has been eliminated as a top source with the AD-CVD duties on P fertilizer as seen in the HS 3105 fertilizer combination column. Saudi Arabia doubled its exports to US between 2018 and 2021 see 3105 column) to become be 4th top source. EU increased its exports to the US by $100 million via 3103 (K), and 3105 (mixtures). Jordan emerges in top 10 source with $263 million fertilizer mixtures. Israel gains by $80 million in the P and K markets. Trinidad and Tobago gains 60 million in N (3102), but these will likely disappear with the forthcoming duties on N fertilizers. Algeria doubles its exports of N fertilizer and these could increase further with the AD-CVD duties on nitrogen fertilizers.
Appendix Table 2. U.S. bilateral imports of fertilizer by top source
(Data from U.S. Trade online (USAtrade.census.gov)
| 2021 (10 months) U.S. imports top ten sources by value (color highlight indicates top ten in each sub-category HS 3102, 3103, 3104, and 3105) | |||||
| Countries | HS 31 all fertilizers | 3102 Mineral Or Chemical Fertilizers, Nitrogenous | 3103 Mineral Or Chemical Fertilizers, Phosphatic | 3104 Mineral Or Chemical Fertilizers, Potassic | 3105 Fertilizer mixtures, (mostly N and P) |
| World Total | $6,616,997,024 | $2,451,508,178 | $176,615,670 | $2,516,467,045 | $1,398,509,018 |
| Canada | $ 2462,253,057 | $483,830,569 | $109,062 | $1,882,571,783 | $82,927,124 |
| Russia | $839,615,936 | $537,481,770 | $256,434,380 | $45,699,786 | |
| Saudi Arabia | $460,831,902 | $124,352,153 | $336,479,749 | ||
| European Union | $380,767,359 | $136,624,766 | $72,898 | $71,118,241 | $150,127,001 |
| Qatar | $356,117,761 | $356,117,761 | |||
| Jordan | $280,503,463 | $16,949,014 | $263,554,449 | ||
| Israel | $243,472,012 | $14,237 | $99,476,590 | $117,288,937 | $25,650,629 |
| Algeria | $212,712,737 | $212,712,737 | |||
| Trinidad and Tobago | $211,161,266 | $211,161,266 | |||
| Belarus | $157,142,251 | $22,243 | $157,073,560 | ||
| total top 10 | $5,604,577,744 | ||||
| 2018 U.S. imports top ten sources (pre phosphate AD-CVD duties) | |||||
| World Total | $6,738,867,087 | $2,235,109,322 | $142,333,786 | $2,748,286,392 | $1,537,553,347 |
| Canada | $2,846,687,986 | $432,325,818 | $80,691 | $2,347,152,359 | $50,880,689 |
| Russia | $922,554,177 | $390,902,390 | $144,829,148 | $386,822,639 | |
| Morocco | $771,011,517 | $56,268,388 | $714,743,129 | ||
| Qatar | $371,156,175 | $371,156,175 | |||
| European Union | $297,623,693 | $137,996,117 | $161,679 | $46,394,784 | $86,403,287 |
| Saudi Arabia | $212,394,058 | $176,755,095 | $35,638,963 | ||
| Israel | $160,931,430 | $25,120 | $72,141,125 | $53,023,690 | $35,664,541 |
| Trinidad and Tobago | $154,772,640 | $154,772,640 | |||
| Belarus | $144,256,593 | $3,546,527 | $140,710,066 | ||
| Algeria | $106,885,635 | $106,885,635 | |||
| total top 10 | $5,988,273,904 | ||||
John Beghin is a professor and Michael Yanney Chair in the Department of Agricultural Economics. Lia Nogueira is an associate professor in the Department of Agricultural Economics. Both are part of the Clayton Yeutter Institute for International Trade and Finance.