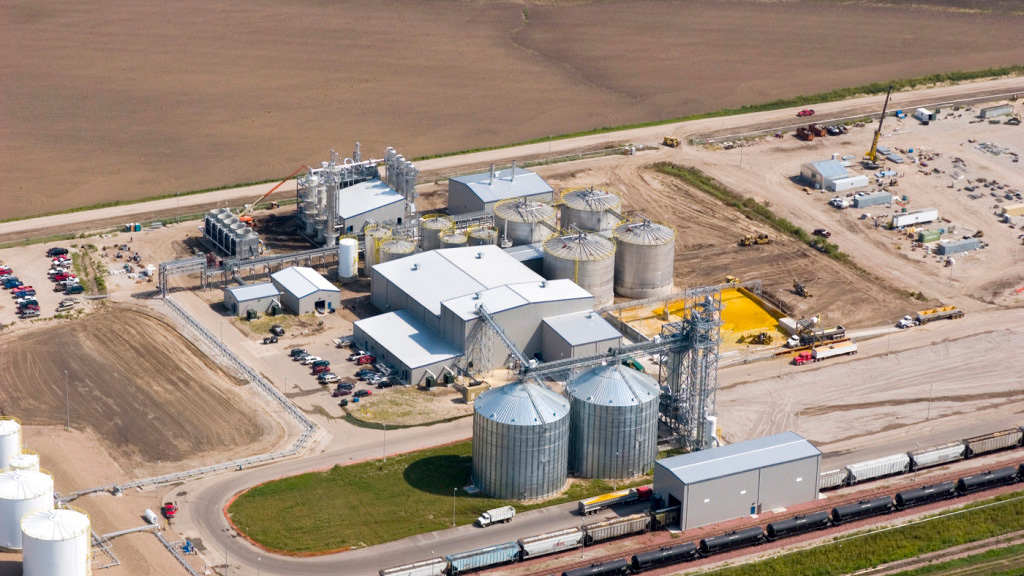
Madrid, Nebraska, Ethanol Plant (Nebraska Ethanol Board).
Commodity marketing operates in a complex decision environment with constant information flow, which can conceal long-run financially profitable marketing opportunities for producers. In the corn marketing space, the competitive role of ethanol plants throughout the state may provide producers with long-run financial gains by strategically approaching marketing decisions. In this article, we characterize whether producers can gain financially from strategically marketing corn to ethanol plants. For example, do ethanol plants provide a better long-run return from pre-harvest hedging, spring sale, or harvest sale?
We investigate three important contracting times – forward contract for harvest delivery (called pre-harvest hereafter), harvest delivery, and spring sale – from ethanol plants that differ in capacity. This difference in capacity, in turn, impacts the size of the grain bid.
Our results focus on observed corn prices. There are more elements to consider when selling crops, such as patronage (if any), unloading wait times, corn discount schedules (e.g., test weight, moisture), and opportunity cost of time. As we focus on price, our results provide a useful starting point to take these other important conditions into account.
Approach
We evaluate corn marketing opportunities for six ethanol plants from 2009 to 2021 in Nebraska. The chosen e-plants vary in production capacity, exemplifying the market structure in Nebraska, and are grouped into three size categories - large, medium, and small. Around each ethanol plant, we consider three grain elevators and three farms. Elevators consist of varied sizes and capabilities (e.g., shuttle loaders on the main railroad line vs smaller elevator on a spur line) at separate distances away from the ethanol plant. Farms are located equidistantly between the ethanol plant and their respective elevators, for a total of three producers in each ethanol region. Net prices are then calculated for the producers – grain bid less the transportation cost of delivery for each buyer. We average the three producers’ net price to generate one value per ethanol plant per year.
Marketing opportunities are calculated for a pre-harvest, harvest, and spring sale using the following approach. We first consider net price from pre-harvest marketing as this represents an important opportunity to market new crop grain. Pre-harvest price is the average price of prices each trading day one week before the crop is 75% silking and one week after. As seventy-five percent silking represents a reasonable time to project final yield, this is an opportunistic time to consider forward marketing. Harvest sale represents the average price of a two-week window around 50% harvest progress. The spring sale price represents the average price during a two-week window seven- months after harvest price. For spring sale, cost increases with time as storage is used.
Positive net prices indicate financial benefits to delivering to the ethanol plant whereas negative net prices indicate a financial cost of delivering to the ethanol plant over the grain elevator. We begin the analysis with the overall impact of ethanol plants on producer net prices to provide a big picture on the influence of ethanol. We then move into investigating marketing opportunities by contract time and ethanol plant capacity.
Historical View Results
Overall
Results from the historical analysis indicate that selling to the ethanol plant generally provides positive net prices. Figure 1 presents the net benefit from selling to the ethanol plant over local elevators in dollars per bushel. This result spans across all three marketing periods, considering four different farmer locations (near ethanol plant, equidistant between, near elevator, and beyond elevator). Note that in the remaining portion we only consider a producer located equidistantly between an elevator and ethanol plant. As noted, positive numbers indicate a net benefit in selling to the ethanol plant, while negative numbers indicate a loss, implying a better price at the elevator. On average, there exists a $0.09/bu gain in selling to an ethanol plant. There also exists a broad range in outcomes from negative $0.25/bu to positive $0.45/bu. Results suggest that larger ethanol plants provide a higher chance of a positive net benefit than medium and smaller sized ethanol plants. For more information on the role of ethanol plants in NE, see Austin Harthoorn’s MS thesis: https://digitalcommons.unl.edu/agecondiss/76/.
Figure 1. Net prices of selling to an ethanol plant

Marketing Opportunities
For strategic marketing opportunities we investigate if the time you sell to the ethanol plant results in a better net price. Here, we compare differences from selling to the ethanol plant versus the elevators in the three different marketing periods (pre-harvest, harvest, and spring sale) throughout our timeframe.
Large E-Plant
Results for the large ethanol plant and an equidistant farm location are presented in both Figure 2 and Table 1. In Figure 2, all three marketing timeframes cross each other through time, indicating that there is no clear marketing strategy generating consistently higher net prices. During the drought of 2012, harvest sales provided the highest return and during other times, for instance, 2018-2020, spring sales provided the highest net price. Pre-harvest sale provided the largest net price in both 2016 and 2017.
With this variability in yearly outcomes, we turn to identifying if a long-run strategy exists. Here we inspect average net prices over time as well as the worst outcome (you must survive the worst outcome to achieve the long-run average). We calculate marketing benefits (or losses) from selling pre-harvest vs. harvest and spring vs. harvest, Table 1. On average, the pre-harvest marketing plan net price $0.10/bu more over the 13 years with the worst year being negative $0.16/bu, meaning the harvest sale exceeded the pre-harvest sale by $0.16/bu (i.e., the drought of 2012). For spring sale, we also found a $0.10/bu advantage over harvest sale with the same worst outcome, negative $0.16/bu in 2013.
Results suggest a strategic marketing opportunity exists as we found a $0.10/bu gain in delivering to an ethanol plant from pre-harvest marketing and spring sales over harvest sales. It stands to reason that farmers near a large ethanol plant see a large benefit in selling grain before harvest, specifically in non-drought years. Will this benefit persist into the future? Only additional years of data will be able to answer this question.
Figure 2. Net return ($/bu) selling to large ethanol plant for three marketing time frames

| Year | Sale Time Price | ||||
|---|---|---|---|---|---|
| Pre-harvest | Fall | Spring | Pre-harvest Minus Harvest | Spring Minus Harvest | |
| 2021 | $0.27 | $0.26 | $0.26 | $0.00 | $(0.00) |
| 2020 | $0.16 | $0.10 | $0.16 | $0.05 | $0.06 |
| 2019 | $0.16 | $0.15 | $0.19 | $0.01 | $0.04 |
| 2018 | $0.25 | $0.16 | $0.29 | $0.09 | $0.13 |
| 2017 | $0.26 | $0.20 | $0.23 | $0.07 | $0.03 |
| 2016 | $0.32 | $0.28 | $0.25 | $0.04 | $(0.03) |
| 2015 | $0.25 | $0.27 | $0.25 | $(0.02) | $(0.03) |
| 2014 | $0.23 | $0.23 | $0.29 | $(0.00) | $0.05 |
| 2013 | $0.33 | $0.44 | $0.28 | $(0.11) | $(0.16) |
| 2012 | $0.16 | $0.33 | $0.33 | $(0.16) | $0.00 |
| 2011 | $0.33 | $0.12 | $0.31 | $0.21 | $0.19 |
| 2010 | $0.20 | $0.25 | $0.15 | $(0.05) | $(0.10) |
| 2009 | $0.18 | $0.20 | $0.11 | $(0.02) | $(0.09) |
| Average | $0.10 | $0.10 | |||
| Worst | $(0.16) | $(0.16) | |||
| Best | $0.21 | $0.19 | |||
Medium E-plant
For medium-sized ethanol plants, we have results in eight of the thirteen available years. Results for our medium-sized ethanol plants indicate no clear marketing time consistently generating higher net prices, Figure 3. Moving to the average net prices through time, we find a $0.06/bu more from pre-harvest marketing than harvest sale with the worst individual year being negative $0.12/bu in 2010, table 2. For spring sale, we found a $0.02/bu advantage over harvest sale, with the worst outcome coming in at negative $0.15/bu in 2010.
Marketing gains exist from engaging in pre-harvest selling and storage with a spring sale. However, the size of the gain is small, especially for a spring sale strategy. For selling at a medium-sized ethanol plant, a pre-harvest hedging strategy provides the largest return, over time.
Figure 3. Net return ($/bu) selling to medium sized ethanol plant for three marketing time frames

| Year | Sale Time Price | ||||
|---|---|---|---|---|---|
| Pre-harvest | Harvest | Spring | Pre-harvest Minus Harvest | Spring Minus Harvest | |
| 2021 | $0.02 | $0.04 | $0.11 | $(0.01) | $0.07 |
| 2020 | $0.14 | $0.03 | $0.12 | $0.11 | $0.09 |
| 2019 | $0.16 | $0.10 | $0.10 | $0.06 | $0.00 |
| 2018 | #N/A | $0.04 | $0.10 | $(0.04) | $0.06 |
| 2017 | $0.05 | $0.06 | $0.10 | $(0.01) | $0.04 |
| 2016 | #N/A | #N/A | $0.07 | #N/A | #N/A |
| 2015 | $0.16 | $0.11 | $0.04 | $0.05 | $(0.08) |
| 2014 | #N/A | $0.15 | $0.11 | $(0.15) | $(0.04) |
| 2013 | #N/A | $0.03 | $0.10 | $(0.03) | $0.07 |
| 2012 | $0.32 | $0.04 | $0.03 | $0.27 | $(0.02) |
| 2011 | $0.24 | $0.14 | $0.26 | $0.10 | $0.12 |
| 2010 | $0.11 | $0.23 | $0.08 | $(0.12) | $(0.15) |
| 2009 | #N/A | #N/A | $0.09 | #N/A | #N/A |
| Average | $0.06 | $0.02 | |||
| Worst | $(0.12) | $(0.15) | |||
Small E-plant
For the small-sized ethanol plants, we have results across eight years. Results for our small ethanol plants indicate no clear marketing time consistently generating higher net prices, Figure 4. Moving to the average net price through time we find a $0.03/bu more from pre-harvest marketing than harvest sale with the worst individual year being negative $0.08/bu in 2020, table 2. For spring sale, we found a $0.01/bu advantage over harvest sale with the worst outcome being negative $0.23/bu in 2013. Marketing gains from engaging in either pre-harvest or spring sale strategies here are small.
Figure 4. Net return ($/bu) selling to small-sized ethanol plant for three marketing time frames.

| Year | Sale Time Price | ||||
|---|---|---|---|---|---|
| Pre-harvest | Harvest | Spring | Pre-harvest Minus Harvest | Spring minus Harvest | |
| 2021 | $0.05 | $0.10 | $0.23 | $(0.05) | $0.13 |
| 2020 | $(0.02) | $0.07 | $(0.00) | $(0.08) | $(0.07) |
| 2019 | $0.35 | $0.09 | $0.15 | $0.26 | $0.06 |
| 2018 | $0.05 | #N/A | $0.17 | #N/A | #N/A |
| 2017 | $0.05 | $0.07 | $0.00 | $(0.02) | $(0.07) |
| 2016 | $0.11 | $0.07 | $0.12 | $0.03 | $0.05 |
| 2015 | $0.11 | $0.10 | $0.21 | $0.01 | $0.11 |
| 2014 | $0.13 | $0.07 | $0.15 | $0.06 | $0.08 |
| 2013 | $0.23 | $0.19 | $(0.05) | $0.05 | $(0.23) |
| 2012 | #N/A | #N/A | $0.01 | #N/A | #N/A |
| 2011 | #N/A | #N/A | $0.01 | #N/A | #N/A |
| 2010 | #N/A | #N/A | $0.06 | #N/A | #N/A |
| 2009 | #N/A | #N/A | #N/A | #N/A | #N/A |
| Average | $0.03 | $0.01 | |||
| Worst | $(0.03) | $(0.23) | |||
Conclusions
In this article, we focus on identifying whether financially beneficial long-term marketing opportunities exist when selling to ethanol plants over the local elevator. Results from past data indicate strategic long-term marketing opportunities exist, but the type (pre-harvest or spring) and size of benefit depend upon the size of the ethanol plant. Overall, we found marketing opportunities were found to be the largest with large ethanol plants and the smallest with small ethanol plants. For the type of marketing opportunity, we found the same size benefit between pre-harvest and spring sale for large ethanol plants, whereas pre-harvest hedging provided a higher benefit with medium and small-sized ethanol plants. Independent of circumstance, farms were better off selling to ethanol plants in non-harvest timeframes.
The looming question exists - will these benefits persist (or grow) into the future? Only the addition of more years will reveal if ethanol plants truly provide a strategic advantage to marketing. It is good to be cautious as we have a few years in our sample as the ethanol industry expanded in size not long ago.
This article was first published as part of the University of Nebraska-Lincoln's Department of Agricultural Economics' "Cornhusker Economics" series on May 3, 2023.
Austin Harthoorn
Economist
Nebraska Farm Bureau
(402) 421-4488
austinh@nefb.org
Logan Lloyd
Agribusiness Undergrad Student
University of Nebraska-Lincoln
llloyd2@huskers.unl.edu
Cory Walters
Associate Professor
Department of Agricultural Economics
University of Nebraska-Lincoln
402-472-0366
cwalters7@unl.edu
Kate Brooks
Associate Professor
Department of Agricultural Economics
University of Nebraska-Lincoln
402-472-1749
Kbrooks4@unl.edu