This article was first published in the June 2024 issue of RightRisk News.
Last month’s RightRisk News discussed the significant economic pressures on the agricultural sector arising from persistently high borrowing costs over the last couple of years. While these costs are not historically high, the rapid increase in interest rates over the past two years has received significant attention. This month, we continue to address the issue of interest rates and interest expenses, offering suggestions for managers to explore.
The Impact of Rising Interest Rates on Financial Ratios
The USDA Economic Research Service (USDA-ERS) farm income and wealth statistics indicate that interest expenses are the fastest-growing operating expenditure in 2022 and 2023. Despite this, the financial position of farms, as measured by the liquidity and solvency ratios, has remained relatively stable. Figure 1 shows the debt service ratio and the debt-to-asset ratio for U.S. farms from 1980-2024F.
The debt service ratio, a liquidity measure, is calculated by dividing the value of principal and interest payments by the value of production and government payments. A lower debt service ratio indicates better liquidity. The 22-year average debt service ratio for U.S. farms from 2000-2021 was 0.24. In 2022, it was 0.21; for 2023, it is estimated at 0.24; and for 2024, it is forecasted at 0.26. Although there has been some deterioration in liquidity, these figures are still below the 0.27-2.28 range seen from 2017-2019, indicating a relatively stable sector compared to the 1980s.
The debt-to-asset ratio, a solvency measure, is calculated by dividing total farm debt by total farm assets. A lower ratio is preferred, indicating less reliance on creditors. From 2000-2021, the average debt-to-asset ratio for U.S. farms was 12.92%. In 2022, it was 12.93%; in 2023, it is estimated at 12.73%; and for 2024, it is forecasted at 12.78%. These ratios are consistent with trends since 2000 and significantly better than those observed in the 1980s.
It’s important to note the value of farm assets, influenced by recent inflation, plays a significant role in the debt-to-asset ratio. The high debt-to-asset ratio of the 1980s was a combination of high debt and a decrease in asset values, particularly land values, brought about by the farm crisis. This is why the debt service ratio is important, as it indicates the ability of income to keep up with debt service obligations. Preceding the 1980s farm crisis, the debt service ratio was above 0.30 and stayed above it until 1988.
The Connection Between Borrowing Expenses and Farm Productivity
While it seems intuitive that rising interest rates would negatively impact farm productivity and profitability, the data shows a complex relationship. For instance, the Nebraska Farm Business Inc. data from 2014-2023 reveals that the bottom 33% of profitable farms sometimes had higher or lower average interest expenses compared to the top 33%, with no clear correlation.
Economic theory suggests two key points about the effect of rising interest rates. The first is the borrower’s aversion to risk does matter. The second is the mix of variable versus fixed costs influences the motivation to expand production.
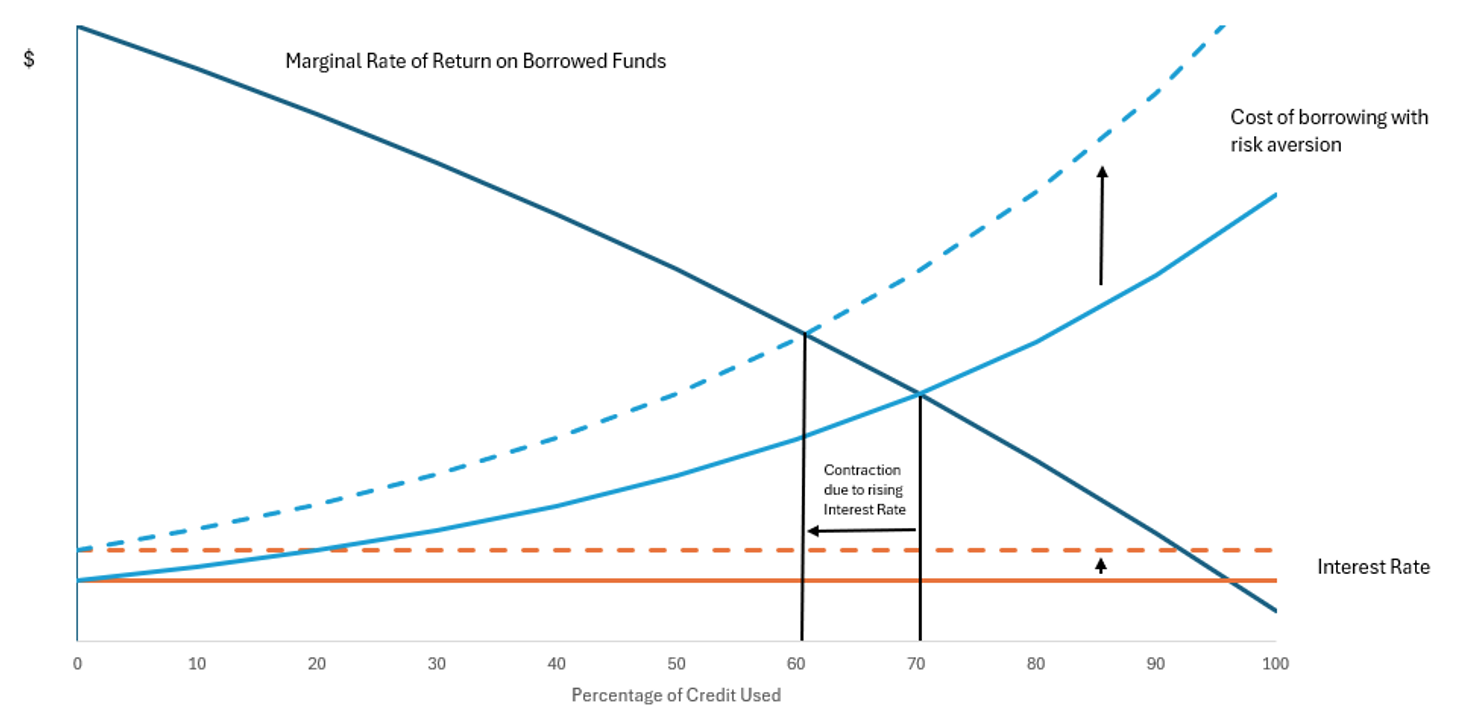
To the first point, the law of diminishing marginal returns indicates that, at some point, each additional dollar borrowed to spend on production will return less than the previous dollar borrowed. If a farm operator is risk-neutral, they will borrow operating money until the return per dollar borrowed matches the cost of borrowing it. However, most individuals are somewhat risk averse. In fact, most business owners’ aversion to risk increases as they use more of their line of credit.
For example, someone borrowing funds at 10 percent interest may add a 25-percentage point risk aversion when they reach 70% leverage. That is, they would only borrow more funds at 10% interest if they thought they could generate a 35 percent return on those funds in the business. As shown in Figure 2, an increase in interest rates pushes this leverage comfort level back, contracting the business to a lower level of production. A 5% increase in the base interest rate would result in moving to a lower level of production, matching the new cost of borrowing with risk aversion.
To the second point, businesses with low fixed costs react differently to rising interest rates than businesses with high fixed costs. For businesses with high fixed costs, borrowing funds for production represents a smaller percentage of overall costs, resulting in less impact on production from higher interest rates. For businesses with low fixed costs, relative to variable production costs, the impact of rising interest rates is more pronounced on production decisions.
A farmer owning most of the land they farm may not be affected as much by an increase in interest rates because most of the farmer’s costs are fixed and are included in the cost of land, providing motivation to expand production to cover those costs. On the other hand, a farmer with few fixed costs knows that each increase in production carries with it a similar increase in total costs. As a result, the effect of increasing interest rates is felt across the board.
Other Considerations
Interest Rate Risk: First, building on the above discussion, interest rate risk, as measured by the coefficient of variation for interest rates, has a more profound effect on high-leverage farms than on low-leverage farms. The higher the interest rate risk, the slower (or lower) the growth rate in the industry. Thus, the greater a farm’s leverage, the lower the growth rate for that farm compared to an equivalent farm with lower leverage in the presence of interest rate risk. Uncertainty about what will happen with interest rates negatively affects farm productivity, even without an increase in rates.
Payment Frequency and Compounding: Another factor to consider is that frequency of payments and compounding matters. The contractual interest rate is what is stated by the lender on a note. However, this may not be the same as the effective interest rate if the compounding is performed more frequently than annually or other expenses, such as closing fees or loan insurance, are included in the repayment plan. Pay attention to the effective interest rate when evaluating a loan offer, not just the annual interest rate stated in the contract.
For example, a loan with annual payments, annual compounding, and an initial loan balance equal to the net proceeds from the loan will have an effective interest rate equal to the annual interest rate. A loan with a 10% interest rate will have an effective interest rate of 10%. On the other hand, if two payments are made per year with two instances of compounding, the 10% annual interest rate becomes a 10.25% effective interest rate. Quarterly payments with quarterly compounding convert a 10% annual interest rate into a 10.38% effective interest rate. Monthly payments with monthly compounding convert a 10% annual interest rate into a 10.47% effective interest rate.
One effect of higher interest rates is that all compounding relationships are scaled up. For a 6% annual interest rate, the effective interest rates are 6.09%, 6.14%, and 6.17% for bi-annual, quarterly, and monthly payments/compounding, respectively. Daily compounding on a 10% annual interest rate results in a 10.52% effective interest rate, while on a 6% annual interest rate, it results in a 6.18% effective interest rate. When loan transaction costs are added to the balance of the loan, they increase the effective interest rate, making it higher than if the interest rate were only charged on loan proceeds.
Real Interest Rates: Finally, real interest rates consider the effects of inflation. For example, an annual interest rate of 4-5% when inflation is at 2% is equivalent to an annual interest rate of 5-6% when inflation is at 3%. The recent increase in interest rates was triggered by an increase in inflation. Pay attention to the difference between these two factors rather than just one or the other. Borrowing money to pay for inputs may make a lot of sense if delaying the purchase of those inputs will result in a higher purchase price.
Summary and Conclusions
High interest rates are a significant concern, but they are only one part of the financial landscape for producers. Maintaining good financial records, a strong performance history, and a thorough understanding of production costs and scenarios are essential for navigating financial challenges and maintaining a strong financial position.
Figure 1: Key Liquidity (Debt Service) and Solvency (Debt-to-Asset) Financial Ratios 1980-2024.
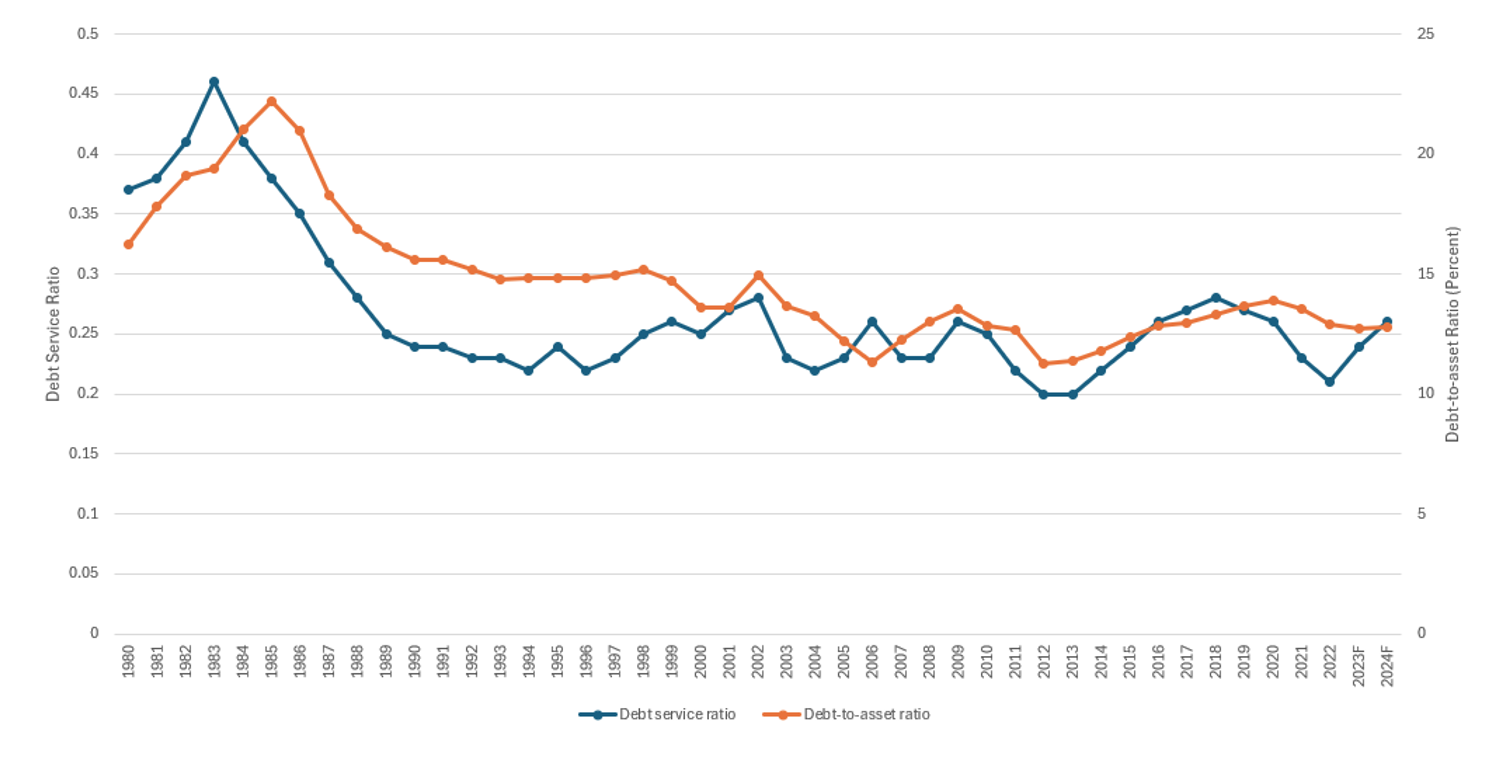
Note: 2023F and 2024F are forecast estimates.
Source: USDA-ERS
Figure 2: Increasing risk aversion to credit usage and the effect of rising interest rates.