Pixabay
This article was first published by "In the Cattle Markets" on Jan. 18, 2022.
Beef cow herds generally consist of four types of cattle: bulls, cows, both bred and development heifers, and feeder cattle. Producers use bulls, cows, and heifers to make feeder cattle. Heifers are either retained from the producers' feeder cattle or are purchased from heifer development programs to replace cows as they move beyond their reproductive life. A beef cow herd grows, both individually and nationally, when the number of cows and heifers is larger this year than the previous year. This signals to the market that more feeder cattle are expected to be delivered to the market in the coming year. Herd contraction is when the number of cows and heifers is smaller this year than the previous year. This signals to the market that fewer feeder cattle are expected to be delivered to the market in the coming year.
A significant amount of attention has been given to the accelerated pace of cow slaughter in the United States, and rightfully so. The pace of beef cow slaughter in 2021 finished with approximately 10% more beef cows harvested in 2021 than in 2020 and 12% more than in 2019. This is the most aggressive year-over-year beef cow slaughter since 2016. This accelerated slaughter has been helped by larger consumer incomes from personal savings, government transfers, and assistance programs. This combined with consumer expectations of supply shortages and higher beef prices has increased beef demand. Higher consumer demand is passed down the beef complex through prices. One impact of this demand shift has been atypically high prices for cull cows during the third and fourth quarters. Seasonally this is when many cows enter the market from pregnancy checking and producers choosing not to rebreed or retain open cows or heifers through the winter. With high feed prices for most feeds, helped of course by 2021 crop production and drought, the decision to take higher feed prices was likely much easier than in previous years. All of this is well known and documented by the industry.
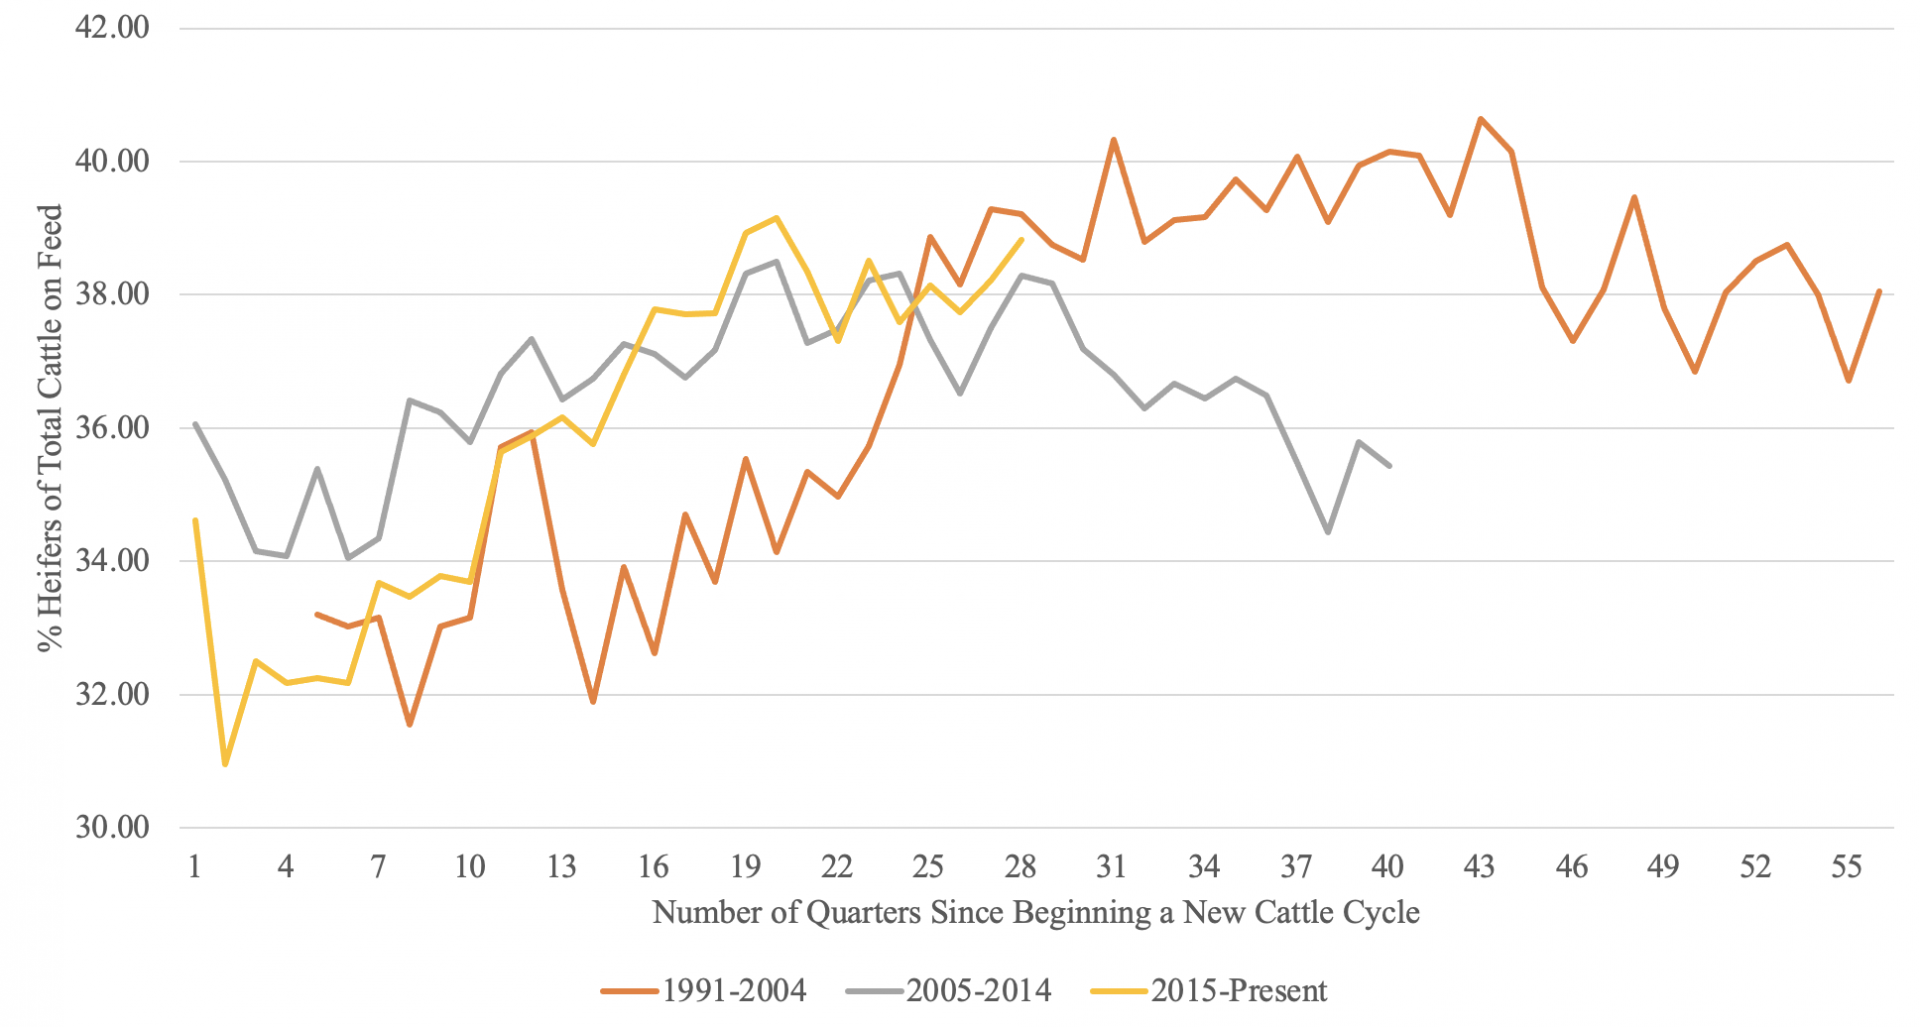
The number of heifers retained in beef cow herds, and thus their impact on herd contraction has been relatively ignored. Each quarter, in addition to their monthly cattle on feed report, USDA-NASS releases the total number of cattle, steers, and heifers on feed for approximately 13 states. This data suggests that heifer placements into feedlots, as a percentage of total cattle on feed, have been increasing (see Figure 1). Some of this is the natural cattle cycle occurring (see Figure 2). During periods of contraction, heifer replacement is high and during periods of herd rebuilding, it is low.
But has the drought accelerated heifer placements into feedlots or have producers been trying to capture short-term profits from stronger fed and feeder cattle prices? One way to look at this is to examine the heifer placement rates by the severity of the drought that region experienced. Table 1 shows the total percent of cattle on feed that are heifers and the severity of drought by state (D3 + D4 drought status). There does not appear to be any direct evidence to suggest that there have been large increases in the number of heifers placed in feedlots due to a worsening drought. The exception to this would be Washington state which saw both worsening drought conditions and a significant increase in the number of heifers placed on feed. All other states saw moderate increases in the percent of cattle on feed that were heifers (~ 2%) and varying drought conditions. This suggests that while the drought may have accelerated the timing of the placements into feedlots, it does not appear that it has affected the proportion of heifers entering feedlots.
So what do the combined effect of accelerated beef cow harvest and heifer feedlot placements mean for herd liquation? First, it could mean that current estimates of a 1-2% reduction in the national beef cow herd would be a conservative estimate. Second, the beef cow herd contraction is not the same across the United States. This has implications for local marketing strategies as well as increased awareness of basis patterns and hedging performance. Basis can widen (i.e., become more negative) during both market growths and declines. Third, the effects of current heifer placements on herd contraction will affect both the 2022 and 2023 USDA cattle inventory report through beef heifer replacement numbers. Taken together, the supply of feeder cattle should be less in 2022 compared to 2021. The CME futures seems to support this idea with Fall 2022 deferred contracts trading in the $180’s range. For places like Nebraska that generally has a +6.00 basis in the Fall for 700-900 lb. steers, expected cash prices are projected to be approximately $188.00 – significantly higher than the lows in 2019 and 2020 and prices not seen nominally since Fall 2014 and Fall 2015. The cost of feed and continued drought conditions are likely to be the largest contributing factors in putting a ceiling on fed and feeder cattle prices in 2022.
| AZ | CA | CO | ID | IA | KS | MN | NE | OK | SD | TX | WA | OTH | US | |
|---|---|---|---|---|---|---|---|---|---|---|---|---|---|---|
| Panel (a): Percent of Heifers of Total Cattle on Feed by Quarter and State | ||||||||||||||
| 2020-01-01 | 1.98 | 13.89 | 46.33 | 38.33 | 26.87 | 46.28 | 14.81 | 39.43 | 43.94 | 42.86 | 38.18 | 42.55 | 35.94 | 38.34 |
| 2020-04-01 | 1.91 | 13.08 | 45.31 | 33.33 | 26.19 | 44.98 | 11.54 | 37.24 | 45.90 | 41.86 | 39.31 | 40.43 | 33.33 | 37.31 |
| 2020-07-01 | 1.83 | 14.68 | 45.10 | 39.29 | 26.19 | 46.44 | 16.00 | 38.94 | 49.21 | 37.84 | 40.07 | 40.00 | 33.33 | 38.51 |
| 2020-10-01 | 1.95 | 14.68 | 41.89 | 44.44 | 24.59 | 45.67 | 14.29 | 37.76 | 44.44 | 39.47 | 37.98 | 45.45 | 34.55 | 37.59 |
| 2021-01-01 | 1.91 | 15.32 | 43.24 | 47.37 | 27.05 | 46.40 | 17.39 | 37.65 | 41.54 | 42.86 | 38.33 | 44.68 | 36.07 | 38.15 |
| 2021-04-01 | 1.84 | 16.22 | 42.45 | 46.55 | 23.02 | 45.16 | 17.39 | 38.37 | 40.00 | 37.50 | 39.37 | 43.90 | 35.00 | 37.74 |
| 2021-07-01 | 1.82 | 15.74 | 43.87 | 44.64 | 21.67 | 46.94 | 15.00 | 37.12 | 43.64 | 37.50 | 40.43 | 44.74 | 34.62 | 38.22 |
| 2021-10-01 | 1.85 | 14.81 | 43.36 | 45.90 | 23.33 | 45.45 | 16.67 | 41.18 | 45.76 | 40.00 | 39.19 | 50.00 | 35.71 | 38.83 |
| Panel (b): Average Percent of Area in State in D3 or D4 Drought Status within Production Quarter | ||||||||||||||
| 2020-01-01 | 0.00 | 0.00 | 0.00 | 0.00 | 0.00 | 0.00 | 0.00 | 0.00 | 0.00 | 0.00 | 3.12 | 0.00 | -a | 0.28 |
| 2020-04-01 | 0.00 | 2.69 | 15.84 | 0.00 | 0.00 | 2.29 | 0.00 | 0.00 | 1.43 | 0.00 | 1.39 | 0.00 | - | 1.24 |
| 2020-07-01 | 25.10 | 3.73 | 37.56 | 4.18 | 0.15 | 0.88 | 0.00 | 1.34 | 1.67 | 0.00 | 7.52 | 0.94 | - | 6.86 |
| 2020-10-01 | 87.43 | 19.74 | 72.95 | 4.23 | 0.86 | 5.41 | 0.00 | 17.57 | 1.96 | 2.04 | 20.56 | 3.72 | - | 19.49 |
| 2021-01-01 | 87.69 | 32.92 | 59.19 | 3.10 | 0.80 | 7.71 | 0.00 | 14.14 | 0.54 | 1.99 | 18.23 | 0.31 | - | 19.60 |
| 2021-04-01 | 86.77 | 68.25 | 30.43 | 0.15 | 2.66 | 0.00 | 0.01 | 0.14 | 0.04 | 14.69 | 13.27 | 8.70 | - | 21.57 |
| 2021-07-01 | 39.08 | 87.62 | 20.53 | 2.67 | 54.85 | 0.00 | 29.76 | 0.83 | 0.22 | 19.77 | 0.00 | 45.15 | - | 24.68 |
| 2021-10-01 | 8.98 | 78.69 | 13.61 | 0.00 | 35.76 | 0.34 | 5.47 | 2.70 | 4.44 | 1.65 | 1.11 | 26.16 | - | 18.48 |
Notes: aNo information is known about the other states included in the quarterly cattle on feed report. Thus, I cannot calculate the drought severity status for these “other” regions.
Supporting Figures
Figure 1. Percent of Total Cattle on Feed that are Heifers Nationally, 1996-2021
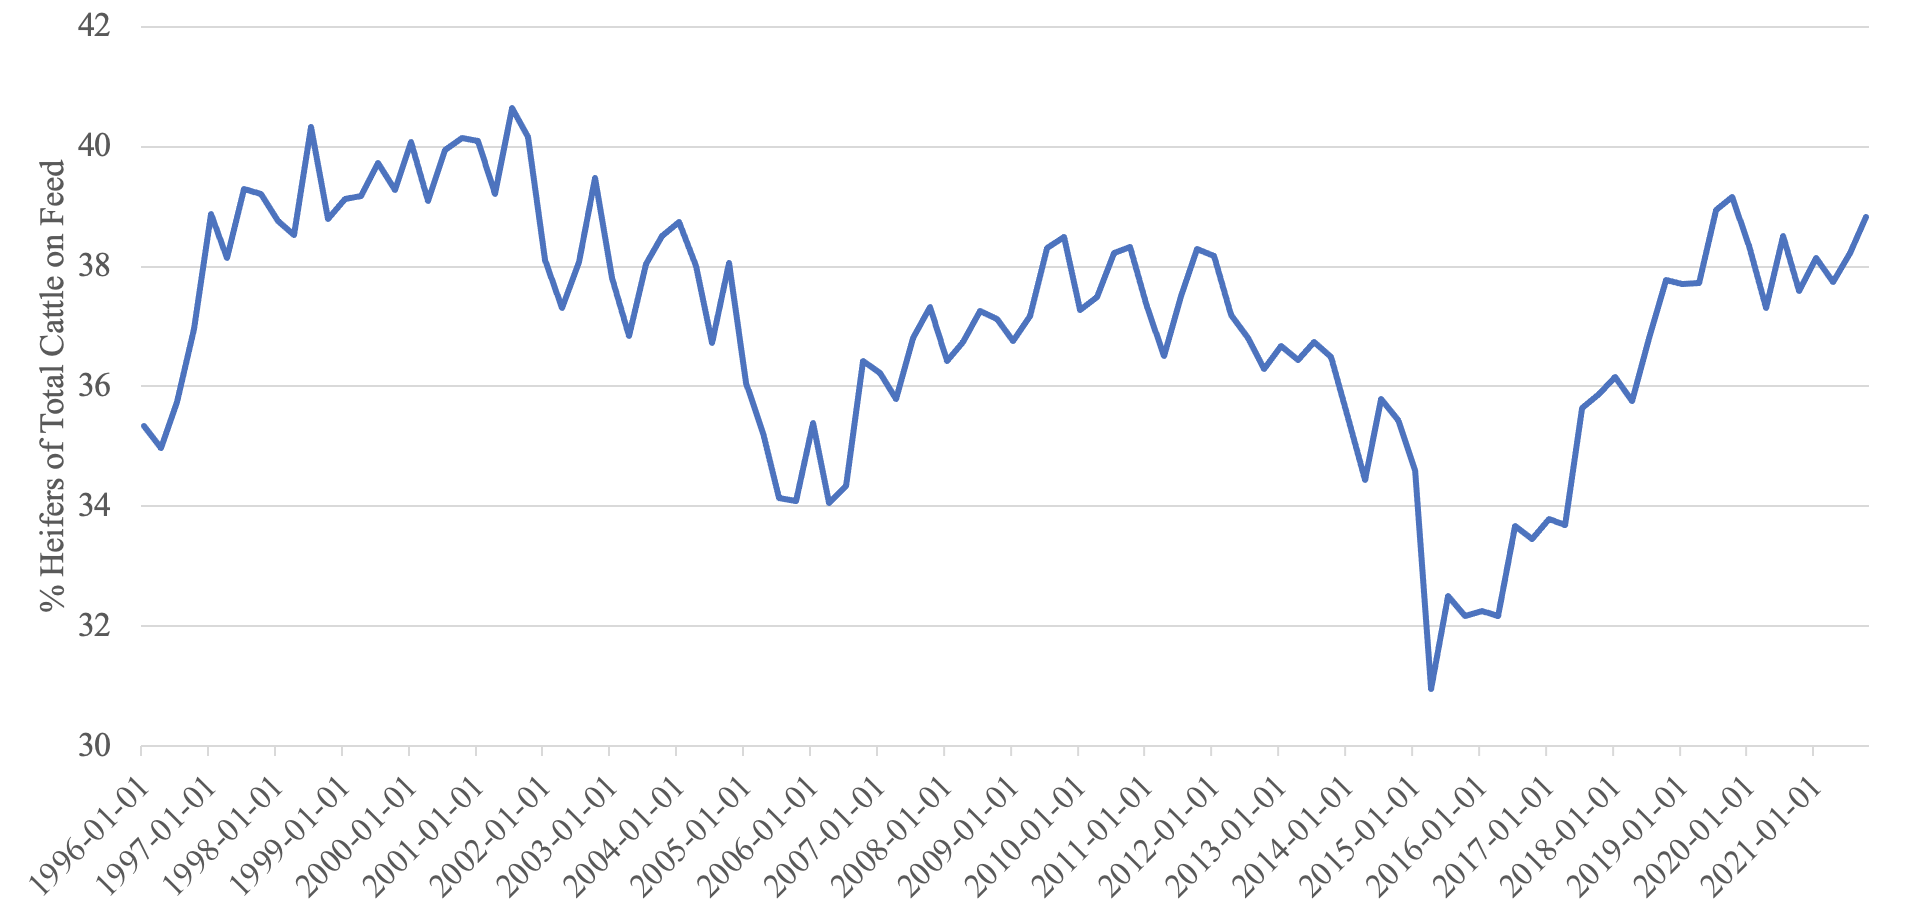
Figure 2. Percent of Total Cattle on Feed that are Heifers Nationally by Number of Quarters Since the Beginning of a New Cattle Cycle, 1992-2021.