Beef cattle wait in a feedlot in Medicine Park, Oklahoma on August 13, 2009. Alice Welch/USDA.
This article was originally published by In The Cattle Markets on April 28, 2020.
In the beginning of COVID-19, much of the attention was focused on managing the redirection of meat product from food service to retail stores. This past month has keenly focused on packing plant closures due to COVID-19 cases among workers and how to manage the supply of fat cattle already ready for slaughter. Fat cattle available for slaughter either cannot get bids or bids are significantly below breakeven prices leaving feedlots with decisions to be made about marketing and placements. The April 2020 Cattle on Feed Report revealed March placement decisions. Placements were down about 10% from February 2020 and 25% from March 2019. This was partially due to depressed nearby and deferred future bids, although the nearby bids appear to be discounted greater, suggesting that the market — at least right now — believes demand for product will recover in the second half of the year. Marketings as a response to plant closures will come in the June 2020 Cattle on Feed report.
Reduction in domestic meat consumption and reduced feedlot placements due to packing plant closures has backed up feeder cattle that would have normally entered feedlots. This has left some cow-calf producers with an unusual decision regarding what to do with feeder cattle — especially those operations which have not normally considered preconditioning, backgrounding or stocking on available forage resources. Prior to making this business decision, it is likely worth asking how much the market is currently willing to pay to put on weight (i.e. value of gain (VOG)) and whether certain weights are more profitable to add weight than others. This is one part of a three-part decision. The other two parts are availability of resources and knowing cost of gain (COG). For example, having available feed resources and a market VOG of $1.05 per cwt. is of little importance if the operational COG is $1.20 per cwt. The operation should not feed out cattle until the VOG COG.
The decision to put on weight in the current COVID-19 market situation is particularly enticing given the hope/expectation that prices will rebound in the future. While it is often assumed that heavier cattle bring more money per head at the time of sale, the increased value often may not be as large as one may expect. This is largely because the COG is generally less than the price of feeder cattle and the price per pound of heavy feeder cattle is often discounted relative to light-weight feeder cattle. This relationship between is often referred to as the price-weight relationship. This relationship is known to change by time of year, weight and sex of cattle and how much weight is to be put on.
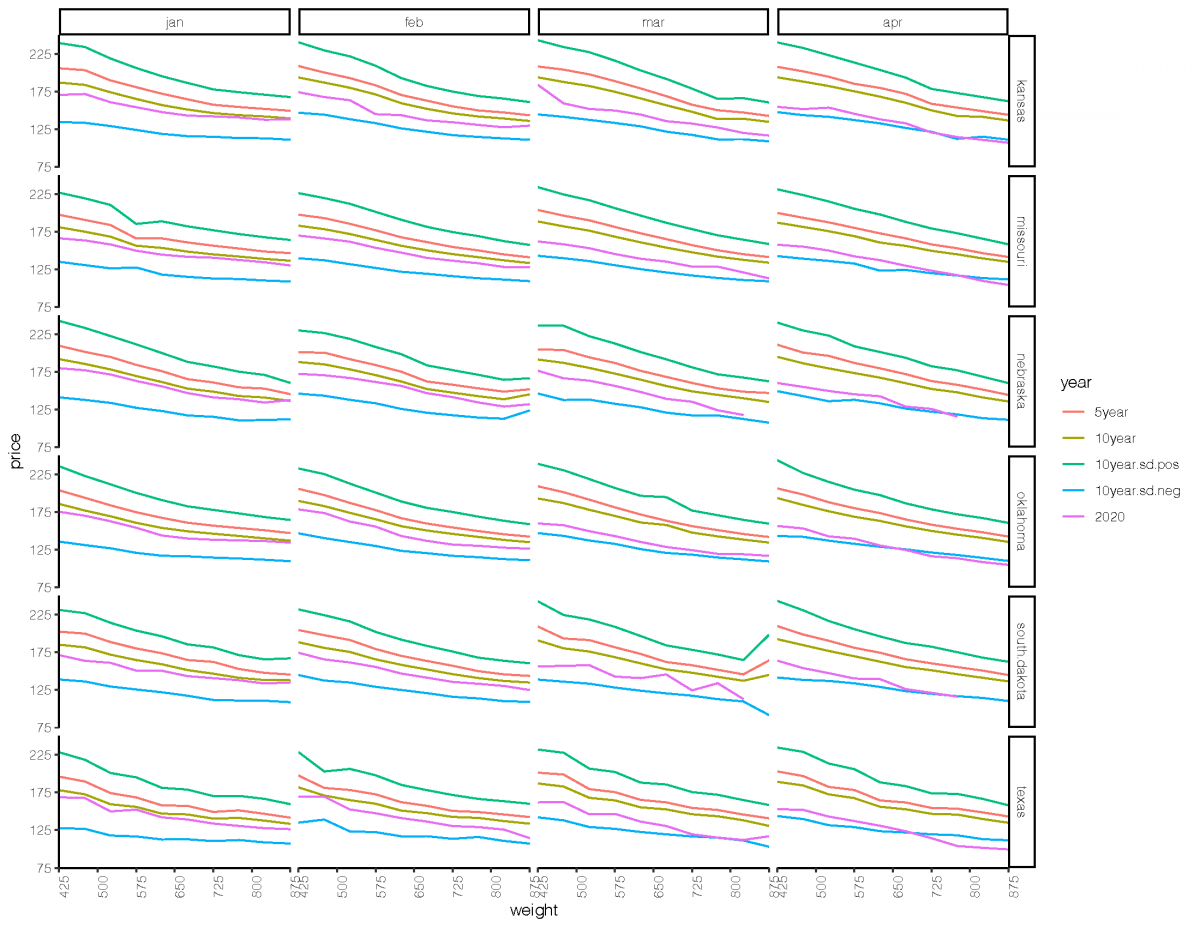
So, have the market situations surrounding COVID-19 changed the structure or level of the price-weight relationship as we enter into the summer months when forage resources tend to be plentiful? Let us look at the price-weight relationships for steers in Kansas, Missouri, Nebraska, Oklahoma, South Dakota and Texas during the first four months of the year. Using data from the Livestock Marketing Information Center (LMIC) from 2010 to 2020, I calculate how the 2020 price-weight relationship compares to the 5- and 10-year historical price-weight relationships in January, February, March and April (see Figure 1).
In January, the 2020 price-weight relationship was largely similar to the 10-year historical average across all states. As we progressed from January to April (left to right in Figure 1), we saw the price-weight relationship gradually shift downward. This reveals that there was merely a vertical shift downwards in the price-weight relationship rather than a structural change in the price-weight relationship. Most 2020 curves are similar in shape when compared to the 5- and 10-year averages. The only exception is Texas discounting heavier cattle in April 2020. Notice that that price-weight relationship gradually approaches one standard deviation from the historical 10-year average. Thus, while prices appear low, they are within what would be considered a statistically acceptable bound.
On the other extreme, feeder prices in 2015 were very high, in some cases at or above one standard deviation from the historical 10-year average. 2015 was an unusual year where feed resources and drought coupled with where the industry was at in the cattle cycle led to higher feeder prices. A similar/counter example could be said of 2020 except with different supply and demand justifications leading to lower prices.
So, if the structure has not changed between weights, what the market is willing to pay me should be similar in previous years except with some discount applied. This is a much better situation compared to if the structure had changed because, in the case of the latter, the value of putting on weight would have been random (i.e. unsure if it would pay or not).
The VOG is one common way to assess how much the market is willing to pay in order to put on weight. This method relies on historical basis patterns and feeder and corn nearby and deferred futures contracts. Using the Beef Basis Stocker VOG tool, I calculate the VOG for steers weighing 500 lbs. on April 27, 2020, gaining 2.0 lbs. per day and potentially sold at different weights and dates throughout the fall. I focus on one representative market in Nebraska, Kansas, Oklahoma and Texas (see Table 1). Of the locations selected, Kansas has the highest and most consistent value of gain at $1.21 per cwt. VOG varies significantly from week to week for other states.
Table 1 shows that adding an “extra 30 lbs.” does not pay the same amount given the time of year and weight cattle are sold at. For example, the VOG of cattle sold at Valentine in Nebraska at the end of July would be $0.81 per cwt. However, if the decision was made to hold cattle another two weeks the VOG would drop significantly to $0.16 per cwt. Similar examples can be seen for other states as well. As expected, as calves are weaned and enter sale barns, the VOG for stocker cattle drops off. Thus, while retaining cattle through summer could be profitable for some enterprises, the timing of the sale largely determines if the added work will pay off.
Retaining cattle through summer may help to dampen the supply chain fiasco resulting from COVID-19 cases among packing plant workers. Its efficacy, though, largely rests on the availability of cheap forage relative to corn. If the pasture and range conditions remain in “very good” to “good” conditions, the longer cattle can be held outside feedlots. However, if pasture and range conditions worsen, then more cattle will need to enter the feedlot, putting more downward pressure on feeder cattle prices. While weather is geographically varied, overall, 2019 was a very wet year with pasture rated poor or very poor consistently 5-10% lower than the historical five-year average throughout the summer and into the fall. In other words, the data suggests that feed resources could be tighter in the summer than last year.
Weather predictions from NOAA would tend to confirm that this year is likely to be warmer that what has been experienced in the past. Temperature tends to oscillate from warm to cool in patterns that span multiple years. The U.S. and Midwestern Plains in particular, are coming out of the cooling cycle and temperatures could rise. NOAA predicted in April 2020 that there is a 60% chance that the weather will be warmer in autumn than in previous years. The accuracy of this prediction as well as where forage conditions worsen first will have a lot to do with the local pricing of feeder cattle and the future supply of feeder cattle.
So, what does all this mean for managing feeder cattle price risk through summer? The long and short is, know the cost of production, find a futures price that maximizes profit and lock it in using available risk management tools, while recognizing that maximum profit this year could be negative. Available risk management tools include futures, options, or Livestock Risk Protection (LRP). One lesson that our industry has painfully learned over the past year or so through the Holcomb fire and now COVID-19 is the urgent need to aggressively and actively manage price risk in all parts of the production process — both the actual price level and price variation.
| Sale Date | Sale Weight | Value of Gain (VOG) per cwt. ($/cwt.) |
|---|---|---|
| Nebraska – Valentine | ||
| 7/30/2020 | 730 | 0.81 |
| 8/14/2020 | 760 | 0.16 |
| 8/29/2020 | 790 | 1.06 |
| 9/13/2020 | 820 | 0.55 |
| 9/28/2020 | 850 | 1.41 |
| 10/13/2020 | 880 | 1.73 |
| Kansas - Pratt | ||
| 7/30/2020 | 730 | 1.02 |
| 8/14/2020 | 760 | 0.98 |
| 8/29/2020 | 790 | 1.23 |
| 9/13/2020 | 820 | 0.91 |
| 9/28/2020 | 850 | 1.21 |
| 10/13/2020 | 880 | 1.21 |
| Oklahoma – National Stockyards | ||
| 7/30/2020 | 730 | 0.68 |
| 8/14/2020 | 760 | 1.03 |
| 8/29/2020 | 790 | 0.89 |
| 9/13/2020 | 820 | 0.87 |
| 9/28/2020 | 850 | 1.48 |
| 10/13/2020 | 880 | 1.32 |
| Texas- Amarillo | ||
| 7/30/2020 | 730 | 0.88 |
| 8/14/2020 | 760 | 0.66 |
| 8/29/2020 | 790 | 1.30 |
| 9/13/2020 | 820 | 1.05 |
| 9/28/2020 | 850 | 1.07 |
| 10/13/2020 | 880 | 0.82 |
CONTACT
Elliott Dennis
Assistant Professor and Livestock Marketing Economist
Department of Agricultural Economics