Preston Keres, USDA (Flickr/Public Domain)
Listen: Nebraska FARMcast
The feeder cattle market has experienced a significant amount of price variation between March and July. There has been upward price pressure from historically strong retail meat demand and meat exports to China. While there have been positive price movements for feeder cattle, most of the downward price pressure has come over the uncertainty of forage production and higher grain prices. Worsening drought conditions in the Western United States have caused feeder cattle and cull cows to come to market earlier and higher grain prices due to low stocks-to-use ratios and worsening global corn production have caused a run-up in grain prices lowering a feedlot’s demand for feeder cattle. Both increasing the supply of feeder cattle from producers and decreasing the demand for feeder cattle from feedlots can result in lower feeder cattle prices.
Sources of Prices for Future Delivery
Price (formed at the intersection of supply and demand) is the signal feeder cattle producers respond to about whether to retain or sell feeder cattle. So where do feeder cattle producers go for price information about delivery of feeder cattle in the future? There are two primary market signals. The first is the futures market. These prices, available at the Chicago Mercantile Exchange (CME), represent the global demand for feeder cattle. An expected local cash price can be estimated by adding a historically observed basis to the futures price that aligns with the delivery month of interest. The advantage is that these price signals are available many months in advance of when production is physically sold in the cash market and offer daily price signals. The second is video auctions. These are production contracts where the buyer and seller agree on a price for a given set of cattle characteristics to be delivered at a certain month and location. The advantage is that the cash price is known before delivery. One of the primary differences between these two forms of contracts is that CME contracts are standardized and video auction contracts can encompass more details about the cattle. While both have advantages and disadvantages, they each provide important market information, regardless of if they are used by feeder cattle producers. In this article, I review what the video auction and futures market is suggesting what the local cash price for feeder cattle will be in Fall 2021.
Video Auction Prices
So, what are video auctions telling producers about potential expected Nebraska feeder cattle cash prices in Fall 2021? I answer this by using publicly available data taken from USDA-AMS for the Superior, Northern, Western, and Torrington Video Auctions between Jan 2021 to July 2021. I restrict my focus to steers or heifers, muscle grade 1 or 2, either a large or medium frame, sold in the North Central Region (CO, IA, MT, ND, NE, SD, WY) that are set to be delivered in either September, October, or November and are not associated with price discounts or premiums.[1] In total there have been 127 lots sold totaling approximately 43,000 head with an average lot size of 336 head.
Figure 1 plots the individually observed transactions segmented by steers and heifers. Points represent individuals lots sold at a given weight and price. The size of the dot represents the number of head within the sold lot. Larger dots indicate more cattle in the lot for a given weight-price point. The solid line and shaded area represent the price-weight slide and one standard error from the average. The wider the shaded area, the more uncertainty there is about price at a given weight. To find out what the video market could pay, on average, for feeder cattle, find a specific weight on the x-axis, go up till you reach the sold red or green line, then draw a horizontal line to the y-axis to find the price. This can provide some signal for what the price will be.
Currently, there are premiums for some heavier feeder cattle (650-775 lbs.). This aligns with market expectations of currently higher corn prices with expectations that prices will come down at harvest. With higher grains prices, feedlots want to place heavier cattle to not feed cattle as long effectively lowering their cost per lb. of gain. Fewer heifers have been sold relative to steers and the prices received are much more variable. Some heavier heifers are also receiving premiums relative to other weights. The video auction prices for steers and heifers and various weights and delivery months are displayed in Table 1.
Feeder Cattle Futures
So, what are CME feeder cattle futures (adjusted for Nebraska historical basis) telling producers about potential expected Nebraska feeder cattle cash prices in Fall 2021? I answer this by using publicly reported data from CME and USDA-AMS compiled by the Livestock Marketing Information Center (LMIC). CME offers standardized 50,000 lb. contracts for 700-899 lb. feeder cattle steers available for delivery in September, October, and November. The feeder cattle contract is electronically settled using the CME Feeder Cattle Index rather than physically delivered. The index uses 700-899 lb. Medium and Large Frame #1 feeder steers and 700 -899 lb. Medium and Large Frame #1-2 feeder steers within a 12-state region. The average feeder cattle futures price in July 2021 for delivery in September, October, and November was $160.22, $162.18, and $163.43, respectively.
Nebraska Feeder Cattle Basis for 700-899 lb. steers and heifers is calculated as the historical Nebraska monthly cash price minus the monthly nearby CME feeder cattle contract. Figure 2 plots the historical basis for 700-899 lb. feeder cattle in Nebraska. The average historical basis between 2010-2020 for September, October, and November are +$5.80, +$5.92, and +$4.95 for steers and -$5.16, -$4.62, and -$4.93 for heifers, respectively.
An expected Nebraska local cash price in September, October, and November can be calculated by historical expected basis plus the feeder cattle futures contract. Thus, the expected average price for 700-899 lb. feeder cattle in September, October, and November are $166.02, $168.10, and $168.38 for steers and $155.06, $157.56, and $158.50 for heifers, respectively.
Comparing Video Auction Prices to CME Futures
Table 2 compares the video auction prices and the calculated expected cash price for Nebraska using current futures plus the historical basis. Across all delivery months, prices are very similar for steers. Heifers are currently more heavily discounted on the video auction relative to the futures. This has two potential implications. First, this may suggest that the basis in the Fall may be weaker than the historical basis observed. The most negative Nebraska heifer basis in the Fall is -$10 per cwt. Even with a historically weak basis, CME futures would still be larger than prices observed for heifers on the video auction for October and November delivery. Second, there have been very few video transactions for 700-899 lb. heifers. As more cattle are sold at this weight prices are likely to rise. Heifer prices going into the fall will likely be a combination of both issues – basis will likely be weaker (more heifers coming to market relative to other locations) and increasing prices as more heifers are sold for Fall 2021 delivery.
[1] Price discounts and premiums include cattle that are categorized as either NHTC, Value Added, Source/Age, Fleshy, Unweaned, Fancy, Spayed, or Split Loads.
Supporting Tables
| Weighted Average Prices ($ per cwt.) | |||
|---|---|---|---|
| September | October | November | |
| Steers | |||
| 400-500 | 212.17 | 196.47 | 199.71 |
| 500-600 | 176.95 | 180.87 | 182.38 |
| 600-700 | - | 168.09 | 169.65 |
| 700-800 | 167.90 | 168.59 | 169.53 |
| 800-900 | 160.96 | 160.52 | - |
| Heifers | |||
| 400-500 | 173.00 | 171.46 | 174.26 |
| 500-600 | 157.65 | 160.20 | 160.60 |
| 600-700 | 159.80 | 152.55 | 154.13 |
| 700-800 | 160.73 | 152.22 | 149.41 |
| 800-900 | 150.87 | 150.78 | - |
Note: “-“ implies that no cattle were sold at that given weight, sex, and delivery month
| Weighted Average Prices ($ per cwt.) | ||||
|---|---|---|---|---|
| Steers (700-899 lbs.) | Heifers (700-899 lbs.) | |||
| Video Auction | CME Futures | Video Auction | CME Futures | |
| September | 167.90 | 166.02 | 160.73 | 155.06 |
| October | 168.59 | 168.10 | 152.22 | 157.56 |
| November | 169.53 | 168.38 | 149.41 | 158.50 |
Supporting Figures
Figure 1. Video Auction Feeder Cattle Prices for Delivery in September – November, North Central Region (Large and Medium Frame, Muscle Grade 1&2)
Source: Superior, Northern, and Torrington Video Auctions Reports (2021)
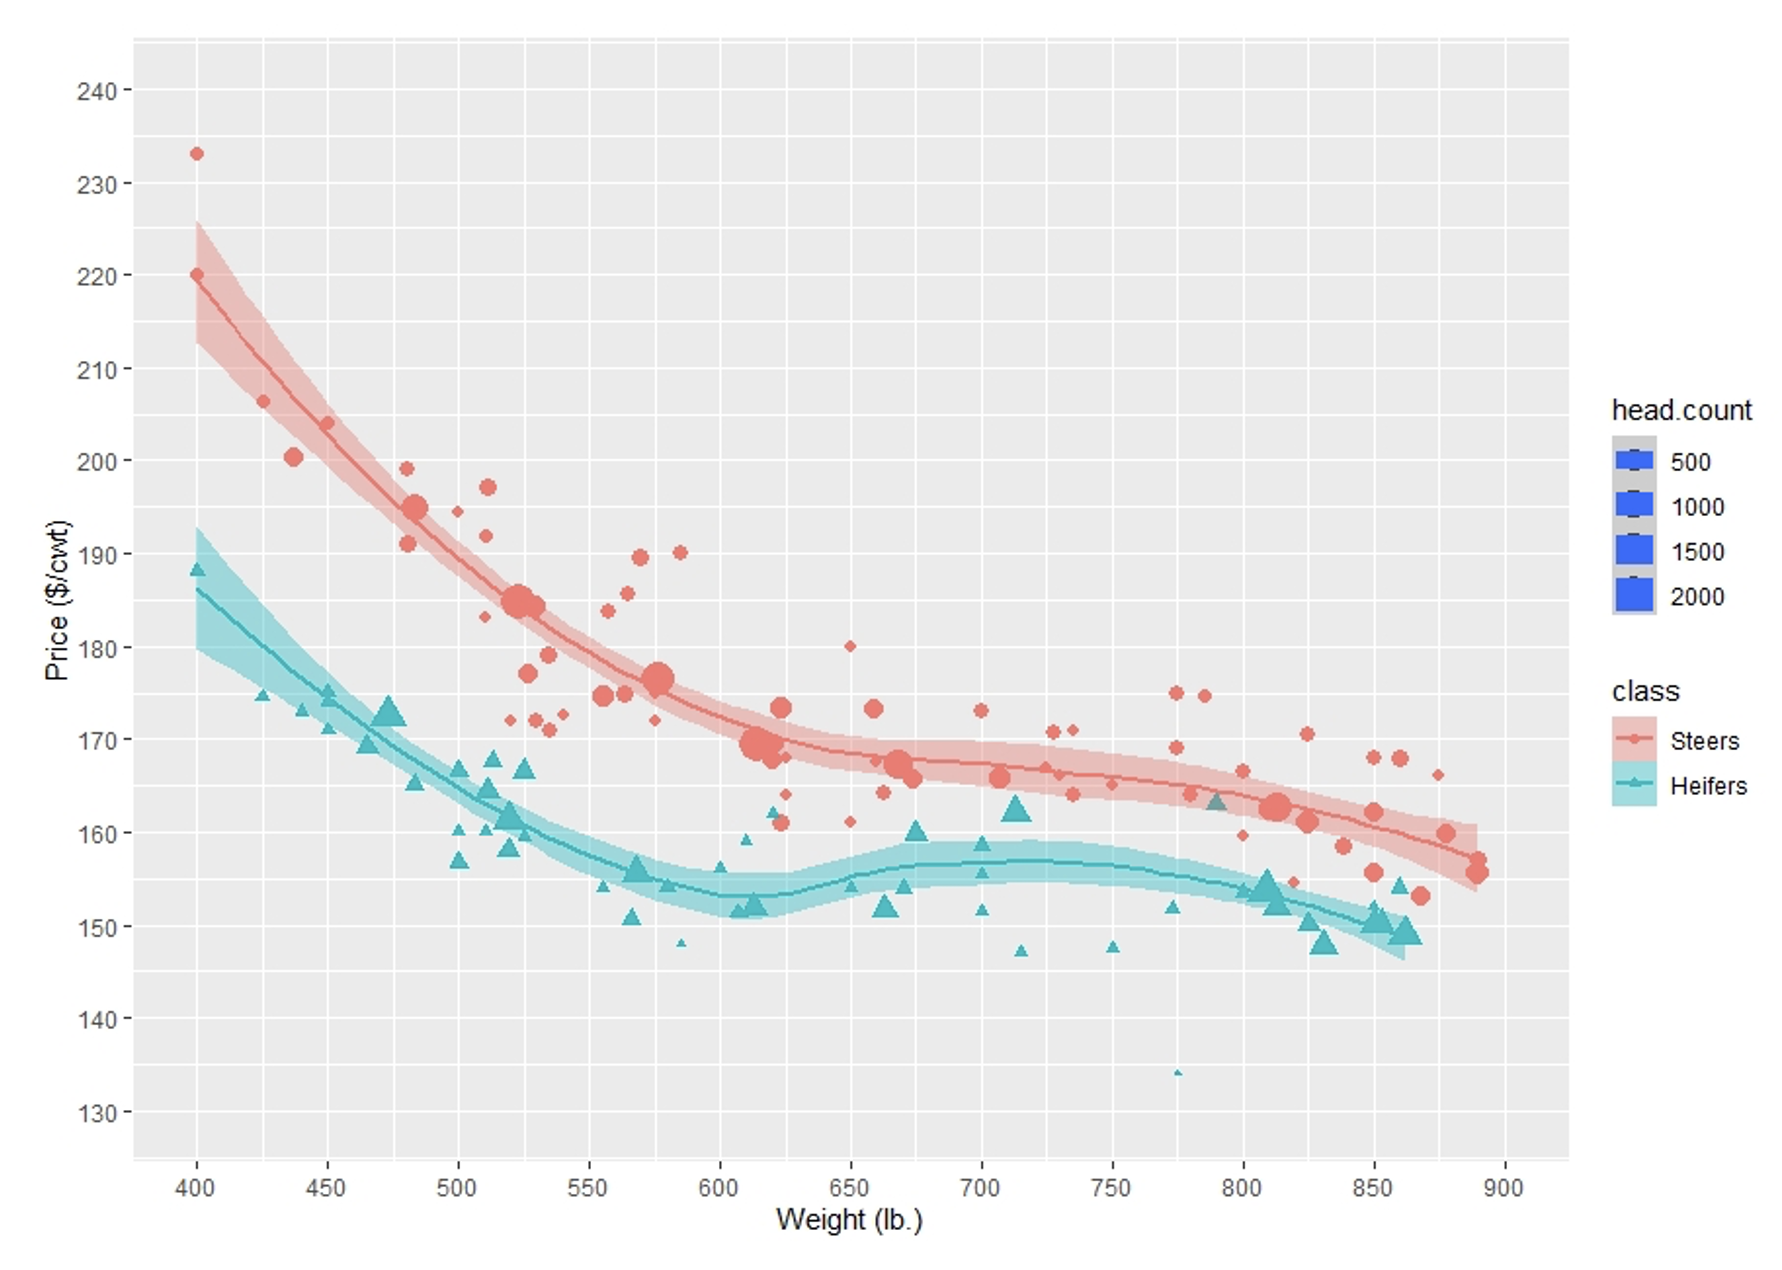
Figure 2. Nebraska 700-899 lb. Steer and Heifer Historical Basis, 2010-2020
Source: USDA-AMS and CME Group (2021)
