Plus, a 10-year glance back at costs and profit margins.
Craig Chandler/University Communication.
Listen: Nebraska FARMcast
The Nebraska crop budgets are prepared in the fall ahead of the new production year. There are some years where costs decrease after projections are made, then at other times, similar to 2022, we see fuel and material input costs increase after the annual budgets are published. Individual producers are encouraged to examine the university budgets carefully and use them as a guide when they prepare their own enterprise budgets. Producers can create their own or modify the budgets as their own prior to using them for decision-making purposes on their own operations. The Center for Ag Profitability’s new Agricultural Budget Calculator (ABC) makes the modification process much simpler since the Nebraska crop budgets can be downloaded into users’ accounts and changed using in the ABC program.
To show the effect of increasing costs, four 2022 UNL budgets downloaded into the ABC program were updated to include the fuel price increases and input cost adjustments since the budgets were originally prepared. Using on-farm-delivery diesel fuel price increases from $2.82/gallon to $3.50/gallon, fertilizer prices to $1.10 per lb/N, and herbicide and pesticide cost increases of approximately 30%, updated cash and economic cost of production estimates for the four budgets are noted in Table 1 for the specific Nebraska crop budgets. Individual producers should review the budgets and make further edits to their current cost of inputs for the 2022 crop year in the budget calculator.
| Cost of Production - Fall estimates | Cost of Production - Updated estimates | |||
|---|---|---|---|---|
| Cash Costs | Economic Costs | Cash Costs | Economic Costs | |
| Corn Budget #23 (dryland, 145 bushel yield estimated) | $2.75/bu | $3.69/bu | $3.39/bu | $4.42/bu |
| Corn Budget #33 (irrigated, 275 bushel yield estimated) | $2.58/bu | $3.48/bu | $3.05/bu | $4.00/bu |
| Soybean Budget #59 (dryland, 50 bushel yield estimated) | $6.71/bu | $9.32/bu | $7.92/bu | $10.75/bu |
| Wheat Budget #76 (dryland, 55 bushel yield estimated) | $4.18/bu | $5.44/bu | $4.76/bu | $6.19/bu |
Klein, R. and McClure, G., Nebraska Crop Budgets, Nov. 2021 https://cap.unl.edu/cropbudgets.
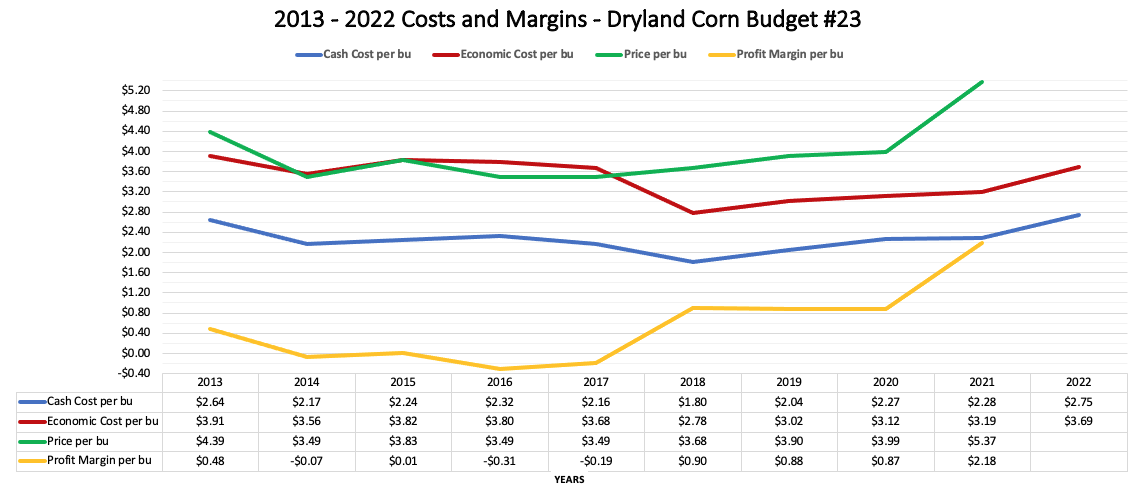
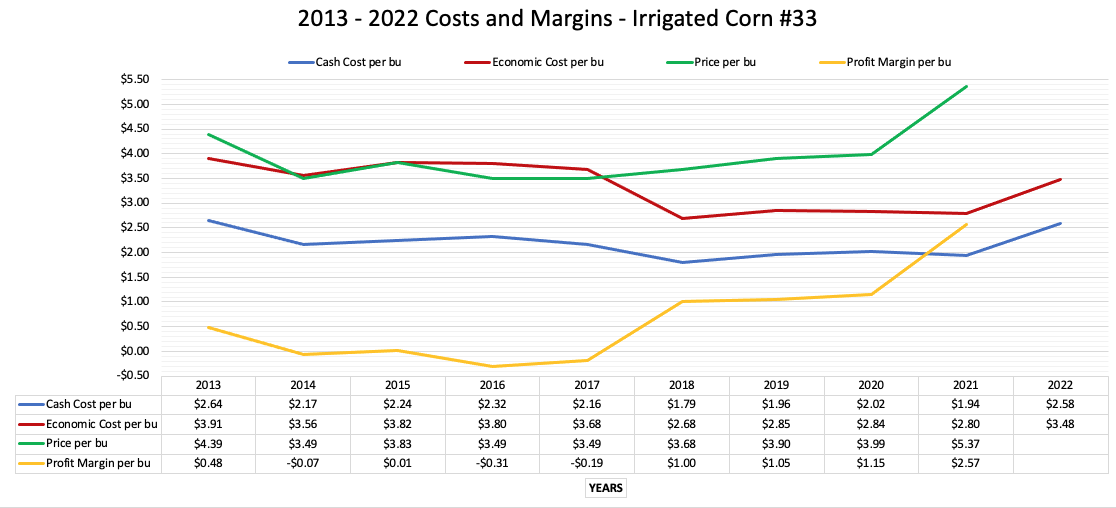
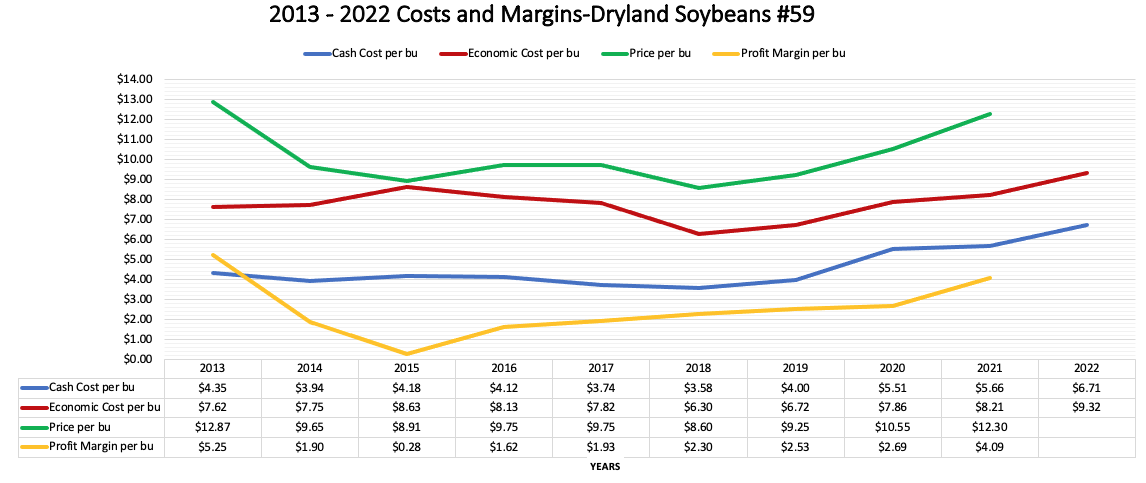
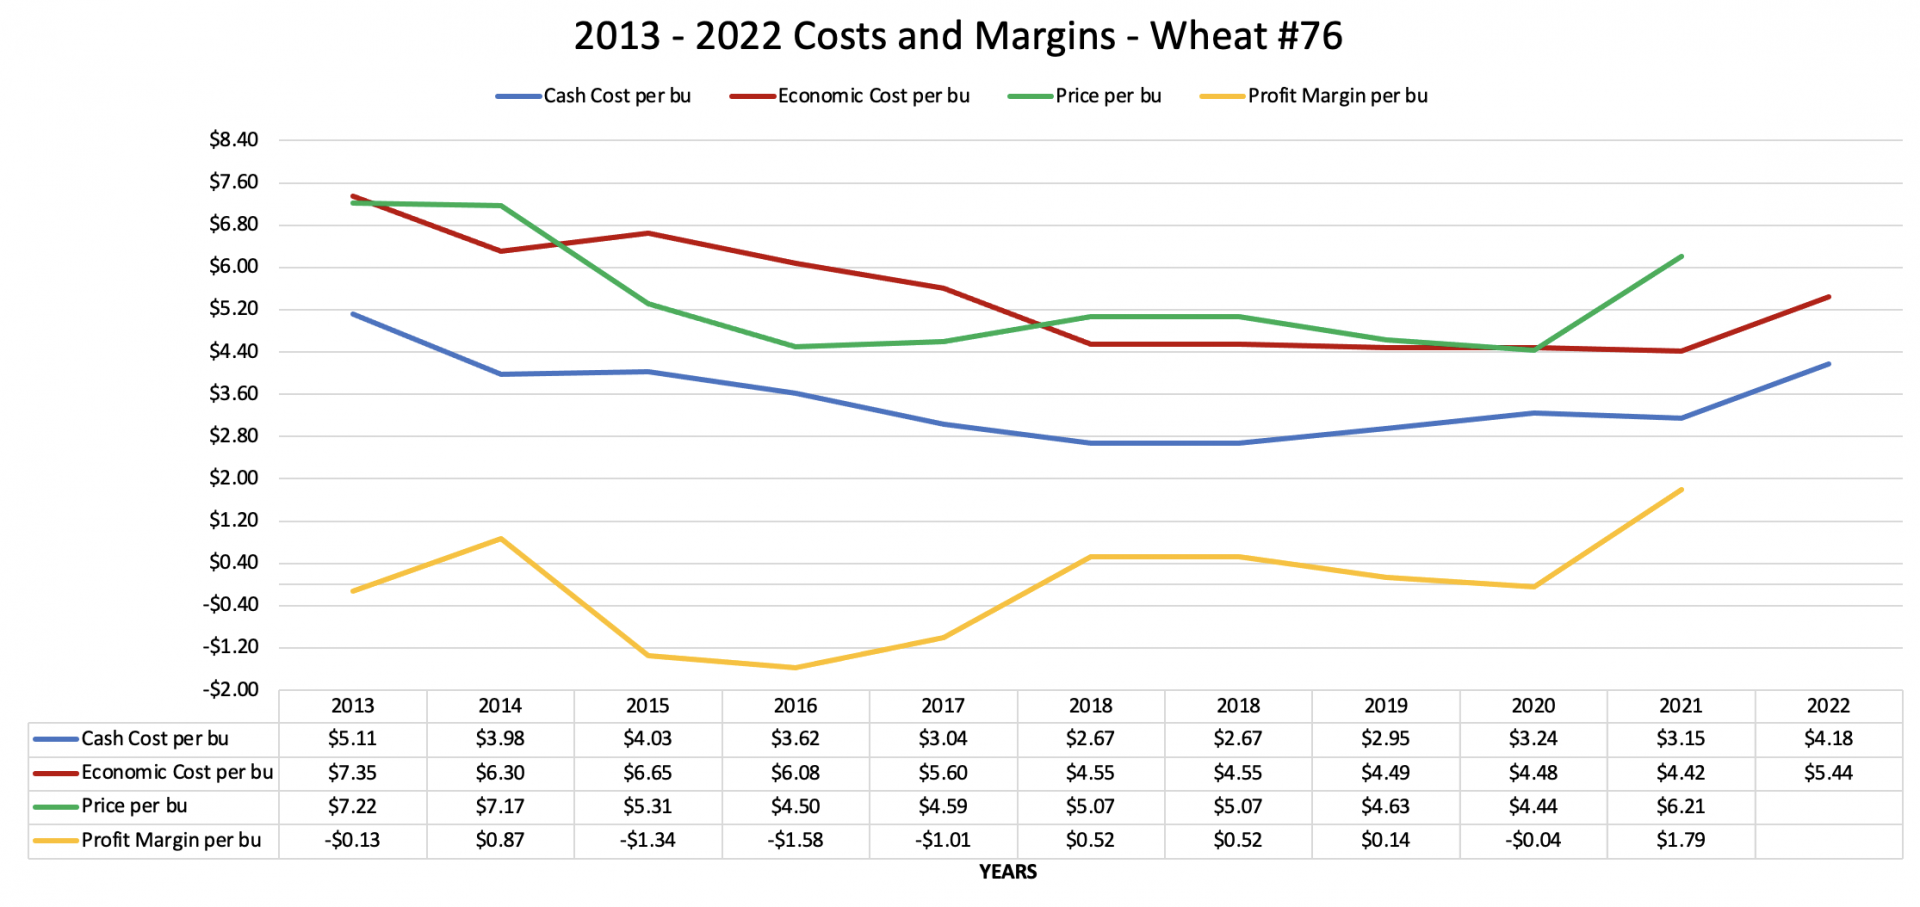
Even with cash and economic cost projections significantly higher for 2022, when factoring in current futures prices, profit margins should be positive. The same four Nebraska crop budgets were used to look back to 2013 with cash and economic projected costs per bushel noted for each year. In addition, profit margins per bushel for each year using crop insurance harvest prices were calculated and charted for each of the 10 years. (Charts 1–4) Government payments received during the 10-year timeframe are not included in revenue.
Profit margins since 2013 range from -$0.31 cents in 2016 for both dryland and irrigated corn, to over $2.00 for corn in 2021. The dryland soybean data shows a low of $1.62/bushel profit margin to $5.25 in 2013, and just over $4.00 in 2021. The wheat budget profit margin ranges from a low of -$1.58 in 2016 to $1.79 per bushel in 2021. While it is still unknown how commodity prices and realized profit margins will end up in 2022, there looks to be positive potential.
Keeping track of your cost of production can guide producers in making management and marketing decisions. While production costs can move up or down, adding in likely commodity prices and revenue into enterprise budgets provides a broader picture. Even in this higher input cost period, opportunities for profitability should exist.
NOTE:In the following charts, profit margins per bushel and breakeven yields are figured from economic cost estimates for four Nebraska crop budgets from 2013 to 2021. Economic costs include opportunity costs and depreciation in addition to cash operating and overhead expenses. Price per bushel used is the crop insurance harvest price for each year. The 2022 harvest price is not yet available.
Source - Crop Insurance Harvest Prices: https://www.fcsamerica.com/products-services/insurance/resources/price-history