This article was first published October 29, 2025, as part of the Department of Agricultural Economics Cornhusker Economics series.
At a Glance
- Researchers estimated the expected carbon intensity of distillers grains and soybean meal produced under Nebraska conditions.
- Feed represents one of the largest contributors to beef cattle emissions, making feed selection an important management factor.
- Wet and modified distillers grains generally have a lower carbon footprint than dried distillers grains or soybean meal.
- Regional differences, irrigation, and feed processing methods all influence carbon intensity outcomes.
- Findings support evidence-based decisions to reduce emissions while maintaining productivity and profitability in beef operations.
Expected Carbon Intensity (CI) of Co-Products Fed to Beef Cattle in Nebraska
Agricultural producers in Nebraska have expressed concern about potential pressure to reduce their carbon footprint, sometimes measured as carbon intensity (CI), carbon dioxide equivalent emissions per unit produced. Carbon emissions are measured over the production "life-cycle", which means tracing back the amounts of emissions attributable to all inputs used, as well as emissions that occur during the production process itself. For beef producers, feedstuffs account for a substantial fraction of life-cycle emissions (Rotz, et al, 2019), so they might lower their beef footprint by using feedstuffs with lower CI. Here we examine the likely CI of two such feedstuffs in Nebraska, soybean meal (SBM) and distillers grains and solubles (DGS).
Co-products and the Allocation of Emissions
Soybean meal and distillers grains with solubles are co-products from joint production, a process in which a single activity simultaneously yields more than one product. Joint production presents a unique problem in calculating carbon intensity: the problem of deciding how much of the carbon footprint of the feedstock grain (soybeans for soybean meal, corn for DGS) to allocate to each of the joint products. But first, let's be clearer about the nature of these co-products.
DGS are a co-product from corn, along with ethanol corn oil[1], typically using the dry mill process. After fermentation and ethanol separation, the remaining stillage, rich in proteins, fibers, and fats, is processed into various forms of the coproduct: wet distillers grains (WDGS), modified distillers grains (MDGS), and dry distillers grains with solubles (DDGS). DDGS, the most common form, is dried to around 11% moisture for easier transport. WDGS has a high moisture content of 60-80%, while MDGS has an intermediate moisture content of around 50%.
SBM is a co-product, along with soybean oil, derived from crushing soybeans. The processing of the soybeans involves cleaning, thermal conditioning, dehulling, flaking, and oil extraction. After oil is removed, the residual meal undergoes heat treatment to enhance its nutritional value. SBM contains about 87-90% dry matter (DM) and 44-49% crude protein on a DM basis.
In cases of joint production of co-products such as these, there is no clear rationale for allocating GHG emissions among them. For example, a dairy cow produces both milk and calves, but there is no straightforward method for determining how much of the cow's feed is used for milk versus how much is used for calves. Similarly, there is no clear basis for deciding how much of the carbon footprint of the corn feedstock should be allocated to ethanol versus DGS, or how much of the soybean carbon footprint should be allocated to soybean oil versus SBM. In life-cycle accounting of GHG emissions, some form of allocation is necessary, but the method used for this can significantly influence the life cycle footprint of co-products, even though it must be somewhat arbitrary.
The International Organization for Standardization (ISO) proposes three main approaches for addressing multiproduct processes: (1) subdividing processes into mono-functional subprocesses with distinct inputs and outputs, (2) system expansion, and (3) allocation that divides inputs and outputs between co-products based on relevant properties. The subdividing approach essentially assumes that co-products are not jointly produced, which does not address the issue for truly jointly-produced products, such as oil and cake from oilseed pressing or meat and milk from dairy cows. System expansion involves identifying carbon intensities for all products for which the co-product substitutes, requiring subjective economic assessments and extensive data collection. This method can also lead to circular or ambiguous allocation scenarios, such as when soybean oil replaces rapeseed oil, a co-product of rapeseed processing, complicating the analysis.
Allocation of emissions among co-products based on a relevant property may be preferred. We argue that economic or value-based allocation is the most logical method for SBM and DGS, as it aligns the GHG emissions burden with the human benefits each co-product provides, as reflected by their market values. Furthermore, this type of allocation reflects the reasons why the co-products were produced at all. Co-products with no positive market value are typically considered "wastes" and should not bear any of the GHG emissions burden. We note that neither are such wastes included in most other allocation methods (mass, energy, protein), a choice that implicitly reflects a fundamental economic value allocation approach.
CI of soybean meal (SBM) and distillers grains with solubles (DGS)
As mentioned earlier, the primary input for DGS is corn, while SBM relies on soybeans. To assess the GHG emissions burden from the production of these grains in Nebraska, we refer to estimates from Perrin et al. (2025). Those estimates were derived using two models: GREET[2] and the IFSM[3]. Perrin et al. (2025) estimated the expected CI of corn and soybean grain under both irrigated and non-irrigated conditions across three sub-regions of Nebraska (Central, East, and West), measured as kg of CO2e kg-1 of grain DM produced (Table 1). Here we focus on the allocation of emissions inherited from the production of the grain, as well as emissions generated during the processing stage.
Table 1. Expected life-cycle Carbon Intensity (CI) values for corn and soybeans produced in Nebraska under standard production practices, no soil carbon emissions included.
| Region | Corn | Soybeans | |||
IFSM | GREET | IFSM | GREET | ||
------------------ kg CO2e kg-1 of grain DM ------------------ | |||||
| East Nebraska | |||||
| Non-irrigated | 0.320 | 0.256 | 0.310 | 0.329 | |
| Irrigated | 0.280 | 0.242 | 0.270 | 0.307 | |
| Central Nebraska | |||||
| Non-irrigated | 0.280 | 0.311 | 0.300 | 0.418 | |
| Irrigated | 0.270 | 0.245 | 0.250 | 0.307 | |
| West Nebraska | |||||
| Non-irrigated | 0.370 | 0.335 | NA | NA | |
| Irrigated | 0.280 | 0.252 | 0.340 | 0.329 | |
| Nebraska averages* | |||||
| Non-irrigated | 0.314 | 0.267 | 0.309 | 0.336 | |
| Irrigated | 0.276 | 0.244 | 0.263 | 0.307 | |
| weighted average | 0.290 | 0.252 | 0.284 | 0.321 | |
*averaged using recent NASS production share weights; NA - Not applicable. Source: Perrin et al. (2025)
The CI of DGS (kg of CO2e kg-1 of dry matter in the DGS) consists of two components: emissions inherited from corn production and emissions from processing. Since WDGS, MDGS, and DDGS differ in the amounts of emissions due to drying, we estimate distinct CIs for each. The recent five-year average value share of co-products was 22% for DGS, 74% for ethanol, and 4% for corn oil. The average dry matter yield of DGS from a kg of dry corn was 0.33 kg.[4] Using the value allocation approach, we allocate 22% of the CO₂e from a kg of corn to the 0.33 kg of DGS dry matter, or 0.67*CIcorn kg CO2e per kg DM in DGS.
Ethanol processing emissions in dry mill plants are about 29.6g CO₂e per MJ of ethanol[5] or 0.165 kg CO₂e per liter, with 0.0657 kg of that due to drying of DDGS, 0.0993 kg due to non-drying processing emissions (Almeida, et al., 2025). Based on economic value we allocate 22%, or 0.0218 kg CO₂e per liter to DGS, which amounts to 0.0346 kg CO₂e per kg of DGS dry matter. WDGS, which does not require drying, only produces emissions from these non-drying processes, for processing emissions of 0.0346 kg CO2e per kg of WDGS dry matter. For DDGS, which requires drying, we attribute 0.0657 kg CO2e per liter due to the drying process, resulting in an additional 0.104 kg CO2e per kg of DDGS dry matter, or processing emissions of 0.0346+0.104. For MDGS, the drying emissions we estimated at half of those for DDGS, so the estimate for drying emissions in MDGS is 0.050 kg CO2e per kg of MDGS DM. Thus, we estimate the CI of DGSs as:
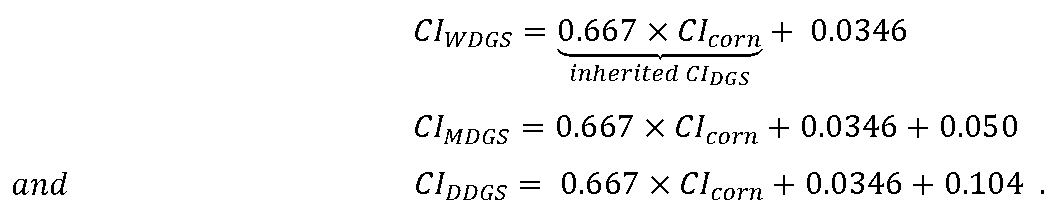
Given the corn CI estimates for various Nebraska circumstances in Table 1, our estimates of expected DGS CI from the corresponding circumstances are presented in the first seven columns of Table 2. DGS CIs vary by region, production practices, and LCA model. For example, CIs for co-products from irrigated crops are about 10% lower than those from rainfed crops. In non-irrigated production, co-product CIs across three regions differ by 15-23%, and under irrigation, they differ by 2-18%. Emissions due to drying cause the expected CI for MDGS to be about 23% higher than that for WDGS, while for DDGS, it is roughly 50% higher.
Table 2. Expected life-cycle Carbon Intensity (CI) for distillers grains with solubles (DGS) and soybean meal (SBM) from crops produced in Nebraska, no soil organic carbon included.
WDGS | MDGS | DDGS | SBM | ||||||
IFSM | GREET | IFSM | GREET | IFSM | GREET | IFSM | GREET | ||
------------------------------- kg CO2e kg-1 of co-product DM ------------------------------ | |||||||||
| East Nebraska | |||||||||
| Non-irrigated | 0.248 | 0.205 | 0.298 | 0.255 | 0.352 | 0.309 | 0.375 | 0.389 | |
| Irrigated | 0.221 | 0.196 | 0.271 | 0.246 | 0.325 | 0.300 | 0.345 | 0.372 | |
| Central Nebraska | |||||||||
| Non-irrigated | 0.221 | 0.242 | 0.271 | 0.292 | 0.325 | 0.346 | 0.367 | 0.456 | |
| Irrigated | 0.215 | 0.198 | 0.265 | 0.248 | 0.319 | 0.302 | 0.330 | 0.372 | |
| West Nebraska | |||||||||
| Non-irrigated | 0.281 | 0.258 | 0.331 | 0.308 | 0.385 | 0.362 | NA | NA | |
| Irrigated | 0.221 | 0.203 | 0.271 | 0.253 | 0.325 | 0.307 | 0.397 | 0.389 | |
| Nebraska averages* | |||||||||
| Non-irrigated | 0.244 | 0.213 | 0.294 | 0.263 | 0.348 | 0.317 | 0.374 | 0.394 | |
| Irrigated | 0.219 | 0.197 | 0.269 | 0.247 | 0.323 | 0.301 | 0.339 | 0.372 | |
| Weighted average | 0.228 | 0.203 | 0.278 | 0.253 | 0.332 | 0.307 | 0.355 | 0.383 | |
*using recent NASS production share weights
The CI of SBM consists of emissions from both the soybean production and processing stages. Based on trends over the past decade, we assign a value share of 40% to soybean oil and 60% to SBM[6]. To calculate the emissions inherited by SBM from soybean production, we use the recent conversion ratio of 0.803 kg of SBM DM per kg of soybean DM. Therefore, the inherited emissions per kg of SBM are (1/.803=1.245) x ‘CI of soybeans’. We allocate 60% of these emissions to SBM. The emissions from the SBM processing stage we estimated at 0.142 kg CO₂e per kg of SBM DM[7]. Thus, our estimates of SBM CI are based on the equation:
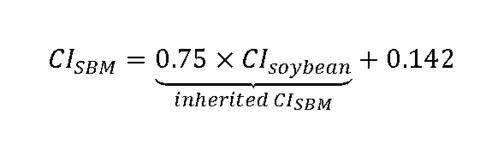
Table 2 indicates that expected IFSM-based CI estimates for SBM range from 0.330 to 0.397, with a weighted average of 0.355. Expected GREET-based estimates for SBM range from 0.372 to 0.456, with a weighted average of 0.383. For comparison, United Soybean Board and National Oilseed Processors Association (2024) estimates the average U.S. CI slightly lower, at 0.304, though the methodology for this estimate is not explained.
Summary
Nebraska beef producers may in the future want to reduce their beef carbon footprint by using feedstuffs with lower carbon intensities (CIs). In a previous article (Perrin, et al, 2025) we reported the likely CI of corn and soybeans produced in Nebraska. Here we extend those results to report the likely CI of DGS and SBM feedstuffs. Beef producers can use this information as they consider lowering the carbon footprint of beef they produce.
The overall expected CI of DGS in Nebraska we found to be 0.23 or 0.20 for WDGS, 0.28 or 0.25 for MDGS and 0.33 or 0.31 for DDGS, depending on whether the IFSM or the GREET model is used. We found the overall expected CI of SBM in Nebraska to be 0.36 or 0.38, depending on whether the IFSM or the GREET model is used.
The results emphasize the variations in the CI of these co-products due to factors such as region, irrigation, and processing methods. This variation indicates that beef producers may be able to lower the CI of beef by selecting co-products with lower CI. These findings support evidence-based decision-making for sustainable livestock management and highlight the need for continued research into the CI of feed co-products, regional farming practices, and more efficient feed production methods.
References
Almeida, Felipe, Richard Perrin, Lilyan Fulginiti and Elliott Dennis. 2025. Carbon Intensity (CI) of co-products fed to beef cattle in the U.S. Department of Agricultural Economics working paper, 2025
Gallagher, Paul W., Winnie C. Yee, and Harry S. Baumes. 2016. 2015 Energy Balance for the Corn-Ethanol Industry. Washington, DC: U.S. Department of Agriculture.
https://www.usda.gov/sites/default/files/documents/2015EnergyBalanceCor…
Perrin, Richard, Felipe Almeida, Lilyan Fulginiti and Elliott Dennis. 2025. Expected Carbon Intensity (CI) of Nebraska Corn and Soybeans. Cornhusker Economics – October 22, 2025
Rotz, C. Alan, Senorpe Asem-Hiablie, Sara Place and Greg Thoma. 2019. Environmental footprints of beef cattle production in the United States. Agricultural Systems 169:1-13
United Soybean Board (USB) and National Oilseed Processors Association (NOPA). 2024. Life Cycle Assessment of U.S. Soybeans, Soybean Meal, and Soy Oil. https://www.nopa.org/wp-content/uploads/2024/02/2024-US-Soy-LCA-Study_P…
[1] These can also be co-products of ethanol production from other grains, such as wheat or barley.
[2] Greenhouse Gases, Regulated Emissions, and Energy Use in Technologies model, maintained by the Department of Energy. GREET models and reference manuals can be downloaded at www.energy.gov/eere/greet.
[3] Integrated Farm Systems Model, maintained by the Department of Agriculture, The model itself and the reference manual can be downloaded at https://www.ars.usda.gov/northeast-area/up-pa/pswmru/docs/integrated-farm-system-model/.
[4] Data from 1/1/2019 to 1/1/2024, from Iowa State University, at www.extension.iastate.edu/agdm/energy.html
[5] see Gallagher, et al, 2016, Table 2.
[6] These and other estimates of quantities involved in soybean processing we take from the Oil Crops Yearbook (Economic Research Service (ERS), 2025) which reports annual average quantities and values of the co-products from crushing soybeans.
[7] Based on United Soybean Board and National Oilseed Processors Association (2024) estimate of 0.126kg CO2e per kg of crude soybean meal, that we convert to DM as 0.126(0.89)-1 = 0.142 kg CO2e per kg of SBM DM.
Richard K. Perrin
Jim Roberts Professor
Department of Agricultural Economics
University of Nebraska-Lincoln
rperrin@unl.edu
Felipe Miranda de Souza Almeida
Graduate Research Assistant
Department of Agricultural Economics
University of Nebraska-Lincoln
falmeida2@huskers.unl.edu
Lilyan E. Fulginiti
Roy Frederick Professor
Department of Agricultural Economics
University of Nebraska-Lincoln
lfulginiti@unl.edu
Elliott Dennis
Associate Professor
Department of Agricultural Economics
University of Nebraska – Lincoln
elliott.dennis@unl.edu
[1] We have encountered measures of corn CI as g of CO2e per MJ, but this is relevant only for corn (or soybeans) that are converted to biofuel. In the case of corn, we multiply CI as g of CO2e per MJ times 0.0108 to obtain lb CO2e per lb grain DM.
[2] We use IFSM (Integrated Farm Simulation Model) because its capacity to estimate CI for livestock as well as crop production makes it suitable for our overall project that examines the potential for sustainable beef.
[3] GREET FD-CIC reports crop CI in grams of GHG per bushel. We convert this to pounds of GHG per pound of dry matter of crop to make it comparable with IFSM values.
[4] These results have not yet received peer review.