
In September, the USDA Farm Service Agency (FSA) opened enrollment for the Agriculture Risk Coverage (ARC) and Price Loss Coverage (PLC) program for the 2026 crop year. Producers must make an ARC or PLC election and enroll in the program by December 11, 2026. Producers will also be able to enroll in the 2027 ARC and PLC program from early November through March 15, 2026.
The enrollment period for 2026 was delayed from the normal spring deadline in part due to the work needed at FSA to implement new program rules and support levels and add additional base acres as a result of language included in the One Big Beautiful Bill Act of 2025. The delay may provide producers with a better assessment of both price prospects and yield results for the 2026 crop year as they choose between the price-based PLC support or the revenue-based ARC support. The decision for 2027 will return to the typical timeline of making decisions before spring planting is generally underway.
In either case, producers will need make an election between ARC and PLC based on their expectations of potential support and further analysis can help improve the decision. At the same time, producers should be receiving payments from FSA for the 2025 crop year. Since the budget reconciliation act increased program supports immediately beginning with 2025 crop year but was passed after the enrollment period had ended, the act included language to pay producers the higher of ARC or PLC payments for the 2025 year. An analysis of those payments can help illustrate the potential support from the programs even if the actual payments ultimately did not depend on the producer decisions.
2025 Farm Program Payments
ARC and PLC payments are both dependent on national marketing year average prices while ARC also includes county or farm-level yield results, depending on whether the farm enrolled in ARC-CO (county) or ARC-IC (individual coverage). The marketing year for each crop runs from harvest into the following year, so the marketing year for most fall-harvested crops ended in August with final prices published at the end of September (except for rice).
For the four largest base acreage program crops in Nebraska, Table 1 provides an assessment of program support levels and resulting payment rates for 2025.
Table 1. ARC and PLC Program Support and Payment Rates for 2025
| Commodity | PLC Effective Reference Price | ARC Effective Price | National Marketing Year Average Price | PLC Payment Rate | Effective ARC-CO Payment Rate at Benchmark Yield |
$/bushel | |||||
| Corn | $4.42 | $4.53 | $4.16 | $0.26 | $0.37 |
| Grain Sorghum | $4.67 | $4.77 | $3.67 | $1.00 | $0.64 |
| Soybeans | $10.71 | $10.95 | $10.50 | $0.21 | $0.45 |
| Wheat | $6.35 | $6.28 | $5.06 | $1.29 | $0.84 |
Looking at corn as an example, the effective reference price for the PLC program was $4.42/bushel and the PLC program would make payments if the national marketing year average price fell below $4.42. For ARC, the program makes payments to producers if the actual revenue based on actual yields and national marketing year average prices fell below the ARC guarantee. The guarantee is based on 90% of the benchmark revenue calculated as the product of the benchmark yield and benchmark price. The table shows an effective ARC price of $4.53/bushel equal to 90% of the benchmark price of $5.03/bushel. This effective price is the price below which ARC would trigger assuming benchmark yields. It provides a price-based comparison with PLC although it is important to remember that ARC is tied to both price and yield. A higher yield relative to the benchmark yield would effectively increase actual revenue and lower the effective price at which ARC would trigger while a lower yield would decrease actual revenue and increase the effective price at which ARC would trigger.
Given the final estimate of the national marketing year average price at $4.16/bushel, the PLC payment rate ends up at $0.26/bushel ($4.42 - $4.16). By comparison the effective ARC payment rate is $0.37/bushel ($4.53 - $4.16) assuming benchmark yield. For corn, ARC ended up triggering at a higher price and paying more per bushel in cases where actual yield was equal to the benchmark. That was also true for soybeans, but for grain sorghum and wheat, PLC make higher payments/bushel again relative to benchmark yields under ARC.
While the above calculations provide a method to compare ARC and PLC payment rates and protection, actual payments to producers will vary. For PLC, the payment rate is equal to the payment rate/bushel times the farm’s program payment yield. For ARC-CO, the payment rate is determined at the county level. For counties where crops are split between irrigated and nonirrigated practices, the farm’s ARC payment rate is calculated from the county rates adjusted for the farm’s historic ratio of irrigated and nonirrigated acres. Based on yield results in the county, the ARC-CO payment rate could range from $0 to a maximum of 12% of the benchmark revenue for each crop by practice.
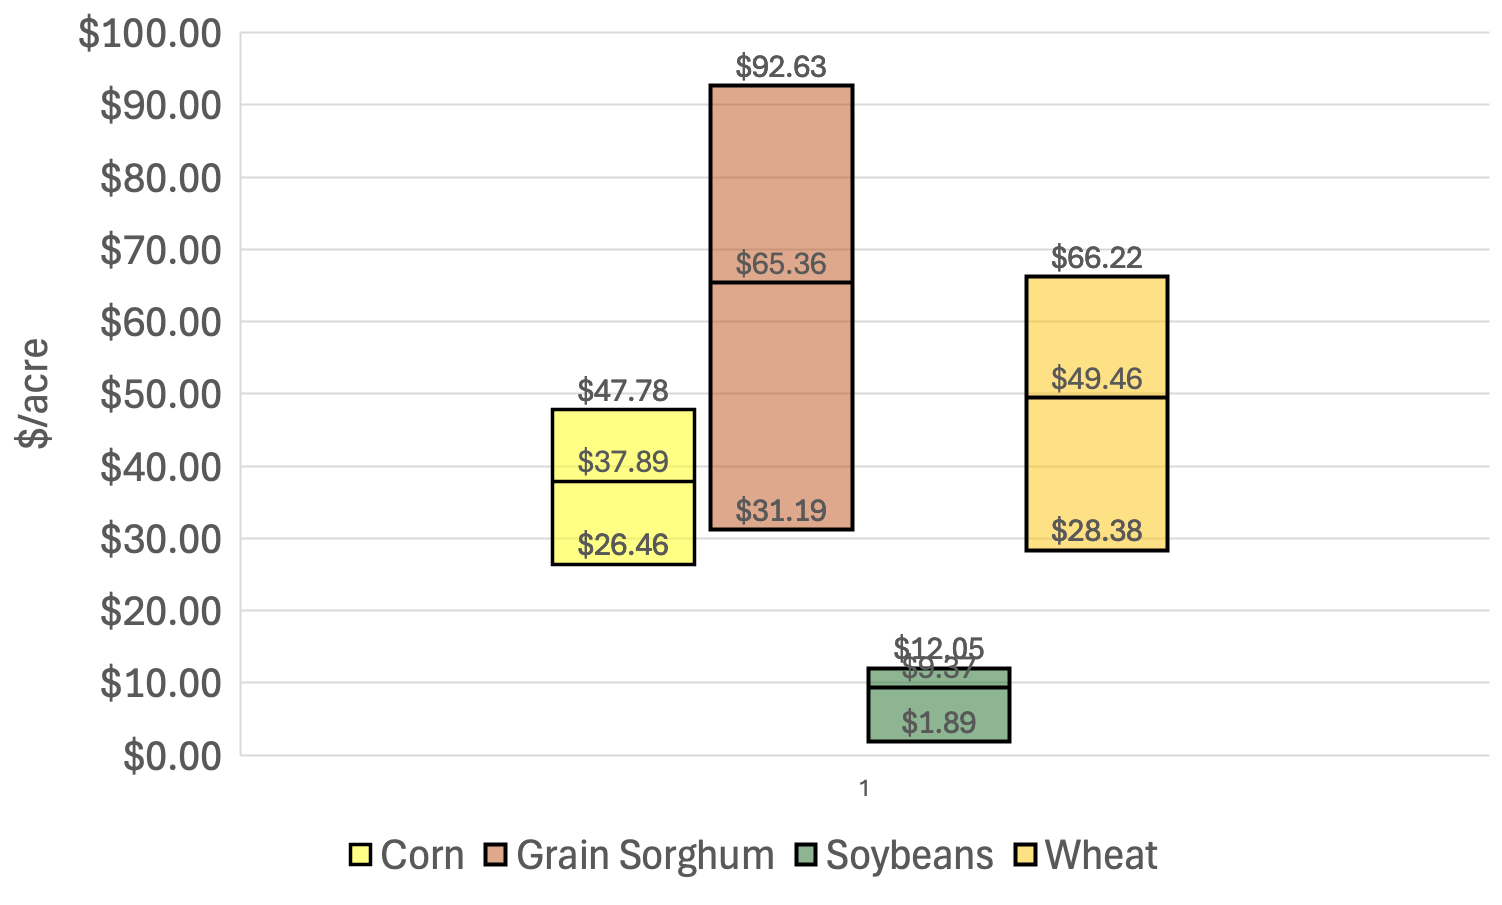
Figures 1 and 2 provide an illustration of ARC and PLC average payment rates for the same crops across Nebraska for 2025. In Figure 1, the minimum ARC-CO payment rate for corn was $0.00/acre. Given a national marketing year average price that would have triggered an ARC payment at benchmark yields, the $0.00/acre payment rate occurred in counties where the yield was at least 8% above the benchmark yield. The highest ARC-CO payment rate for corn was $147.39/acre because of both the lower price and an actual yield far below the benchmark yield. The average ARC-CO payment rate for corn was $57.10/acre. For PLC, the average PLC payment rates based on average program payment yields by county across Nebraska ranged from $26.46/acre to $47.78/acre with an average of $37.89/acre.
The comparison of payment rates helps to reinforce the analysis that ARC tended to pay more and pay faster than PLC for corn and soybeans for 2025, with an average payment rate of $57.10/acre versus $37.89/acre for corn and an average payment rate of $9.61/acre versus $9.37/acre for soybeans. For grain sorghum and wheat, the results reversed, with PLC paying more on average than ARC. However, the range of payment rates for each crop demonstrates that actual payments to producers can vary widely by county and by farm given the relevance of program payment yields and irrigated/nonirrigated ratios unique to each farm as well as county yield results that could vary dramatically across county lines and between irrigated and nonirrigated production even in the same county.
In the end, the analysis of 2025 payment rates is academic, as the producer will receive the higher of the ARC or PLC payment. However, the analysis helps to demonstrate the differences between the ARC and PLC programs and the importance of the decision ahead for 2026 and 2027. Actual payments to producers will be lower than these payment rates. Producers are only paid on 85% of base acres, so effective payment rates per base acre are lower than the calculated payment rates per paid acre shown above. Payments are also reduced by a 5.7% budget sequestration factor tied to previous deficit reduction legislation. Producers are also subject to an ARC and PLC program payment limit of $160,000/person for the 2025 crop program as well as other payment eligibility rules. FSA has announced total ARC and PLC payments for 2025 at nearly $14 billion nationwide before budget sequestration and payment limits are factored in. Aggregate analysis of Nebraska numbers suggests payments could be more than $600 million in the state. Whatever the exact number, total payments will certainly add significantly to producers’ cash flow this fall.
Figure 1. Maximum, Minimum, and Average ARC-CO Payment Rates Across Counties in Nebraska for 2025
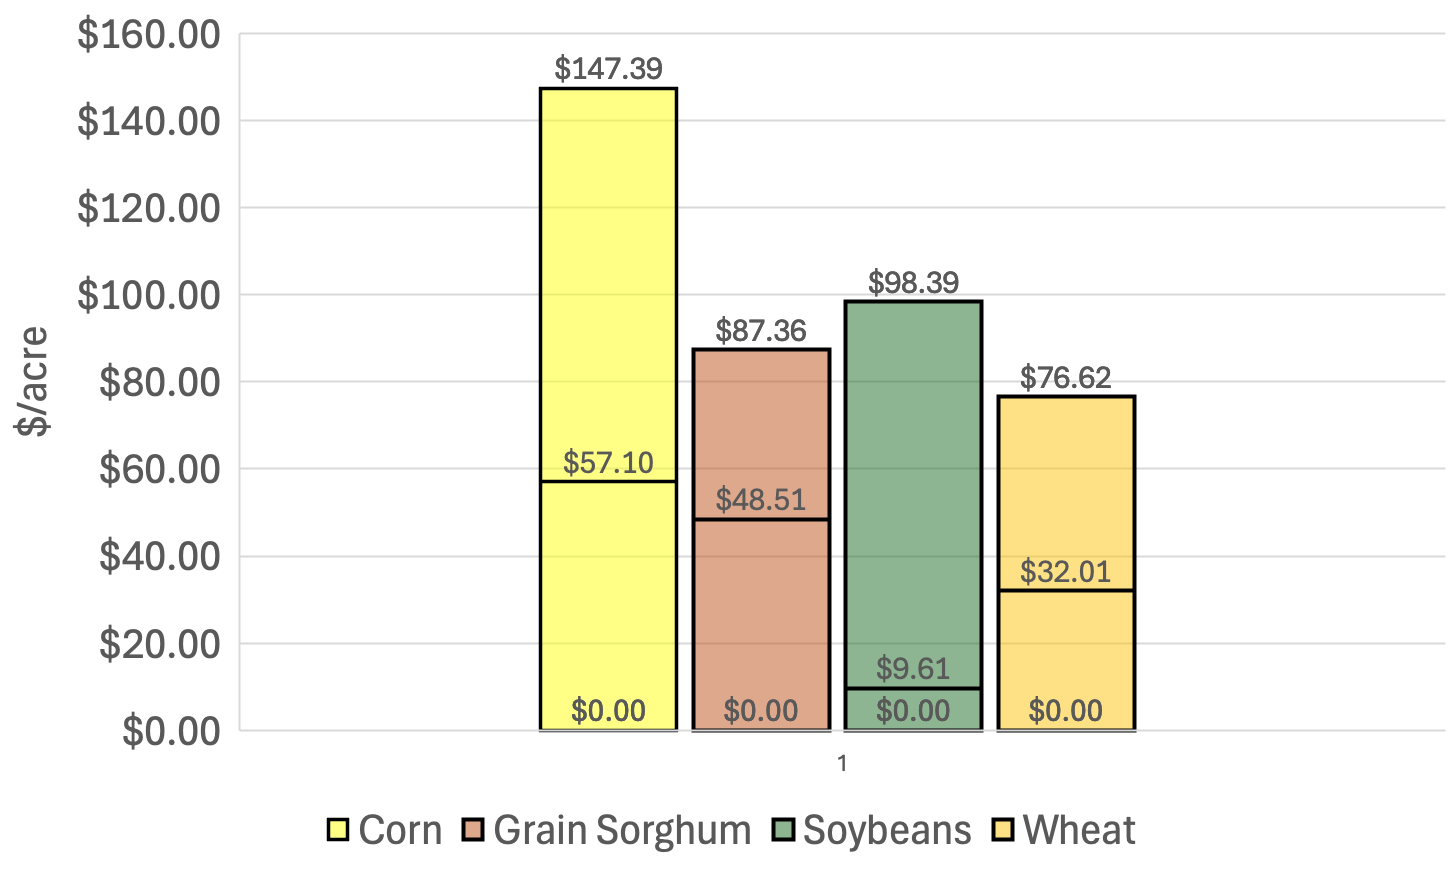
Figure 2. Maximum, Minimum, and Average PLC Payment Rates Across Counties in Nebraska for 2025
2026 Farm Program Decisions
While producers will not automatically receive the higher of ARC or PLC payments for the 2026 crop year in the way they did for 2025, they do benefit from the fact that the enrollment decision is due now instead of last spring as typically would occur. By this point, producers have good knowledge of their individual yields and at least a sense of where county yields are likely to fall relative to benchmark yield levels. They also have projected prices from USDA’s monthly supply and demand reports to add to their own judgement about where prices are likely to end up. Instead of making a decision last spring primarily based on benchmark yield expectations and early-season price projections, producers now have more information from which to judge the performance and projection of the ARC and PLC programs, including the relevance of ARC-IC if farm-level production ended up substantially below expectations.
Table 2 provides the effective reference price for PLC and the effective price for ARC for 2026, the same as Table 1 did for 2025. Interestingly, the numbers end up the same. Both are tied to the higher of a minimum price and a moving average price and while the moving average price is updated each year, it is a 5-year Olympic average that drops the high and low before calculating an average. The 2025 protection was tied to an Olympic average from the 2019-2023 crop marketing years while the 2026 program is tied to the 2020-2024 crop marketing years. In moving forward a year, the low price from the 2019 crop year that was dropped from the average ended up being replaced by a new low price from 2024 crop year that was also dropped from the average, resulting in no change to the Olympic average and no change in the ARC and PLC support levels, at least for the four crops listed.
Table 2. ARC and PLC Program Support for 2026
| Commodity | PLC Effective Reference Price | ARC Effective Price | Projected National Marketing Year Average Price | % Price Change to Trigger PLC | % Revenue Change to Trigger ARC |
$/bushel | |||||
| Corn | $4.42 | $4.53 | $4.80 | -7.9% | -5.7% |
| Grain Sorghum | $4.67 | $4.77 | $4.60 | 1.5% | 3.7% |
| Soybeans | $10.71 | $10.95 | $12.00 | -10.8% | -8.7% |
| Wheat | $6.35 | $6.28 | $6.40 | -0.8% | -1.8% |
Table 2 also shows a projected price for the 2026 crop marketing year that comes from USDA’s September 11, 2026 World Agricultural Supply and Demand Estimates report. This is certainly not a final estimate as the marketing year for the fall-harvested crops just began in September, but it does reflect increased information and analysis relative to price projections that would have been available in the spring.
If price projections were to hold, there would be no PLC payment for corn, soybeans, or wheat for the 2026 crop year. With the effective reference price for corn of $4.42/bushel and a projected price of $4.80/bushel, it would take a price loss of about 8% in corn to trigger a PLC payment. Similarly, it would take a price loss of about 11% in soybeans or 1% in wheat to trigger a payment. On the other hand, grain sorghum would trigger a PLC payment at current price projections and would actually still trigger even if there was a small increase in prices from current projections.
At current price projections, the analysis is similar for ARC. It would take a revenue loss of about 6% for corn, 9% for soybeans, and 2% for wheat to trigger an ARC payment relative to current price projections and benchmark yields. And, like PLC, ARC would trigger for grain sorghum at current price projections, assuming benchmark yield levels.
The analysis suggests that ARC is again likely to trigger first for corn, grain sorghum, and soybeans, just as it did in 2025. For wheat, PLC would likely trigger first. However, that analysis is based on ARC estimates assuming benchmark yields. Given that producers know more about their farm yields and likely county yields for 2026 by this point, the analysis at benchmark yield levels may not be relevant. If producers have yield expectations above benchmark, then the relative price protection in ARC falls and PLC may end up with higher trigger levels. If producers have below benchmark yield expectations, then the relative price protection in ARC goes up. For producers in counties that struggled with weather concerns throughout the year and particularly for wheat producers in counties where drought losses were severe, the relative protection of ARC at the county level or the individual farm level may be substantially better than the price projection offered by PLC. Producers will not know official county yield estimates until late spring 2027, long after this enrollment decision is due, so the analysis is still one of projections, but the delayed enrollment does mean that producers have a better projection of what those yields will likely be.
2027 Farm Program Decisions
Producers are being encouraged to make their 2027 crop year enrollment decision this fall as well while visiting the FSA office to enroll for 2026. The 2027 enrollment period stretches to March 15, 2027, consistent with typical enrollment timelines so producers have a longer time to make a decision. However, they can enroll now and consider coming back to change their 2027 enrollment later if their decision changes.
The current analysis for 2027 is more difficult as producers will not have any foresight as to how the 2027 production year plays out or even what price expectations might be come planting time (except for the extent each year to which they might judge a wheat crop that is already in the ground). Table 3 provides a similar analysis of support levels for ARC and PLC for the 2027 crop year.
Table 3. ARC and PLC Program Support for 2027
| Commodity | PLC Effective Reference Price | ARC Effective Price | Projected National Marketing Year Average Price | % Price Change to Trigger PLC | % Revenue Change to Trigger ARC |
$/bushel | |||||
| Corn | $4.34 | $4.49 | $4.46 | -2.7% | 0.7% |
| Grain Sorghum | $4.40 | $4.66 | $4.40 | 0.0% | 6.0% |
| Soybeans | $10.62 | $10.92 | $11.37 | -6.6% | -3.9% |
| Wheat | $6.35 | $6.28 | $6.47 | -1.9% | -2.9% |
The effective reference prices for PLC and the effective prices for ARC drop for 2027 compared to 2026 for corn, grain sorghum, and soybeans. Crop prices from 2025 replace those from 2020 in the 5-year Olympic average calculations and the lower prices pull the averages down. Wheat remains unchanged given the minimums built into the formulas. The biggest change is in price projections, which may be highly dependent on the source and timing of the projections. The only formal projections for 2027 to this point come from the Food and Agricultural Policy Research Institute (FAPRI) at the University of Missouri. Those projections are the result of comprehensive economic modeling of the U.S. ag sector and generally serve as a primary source of baseline analysis even as they are not formally thought of as forecasts. The FAPRI projections come from analysis in August 2026. While USDA’s supply and demand estimates for 2026 published in September may account for more the current run-up in prices for the current crop, they don’t include projections for 2027 at this time and FAPRI’s long-run projections presume a general return toward lower longer-run price levels for many commodities. The projections fall for corn, grain sorghum, and soybeans, while wheat projects a slight increase.
Whatever the price projections are, it is clear that the effective support levels provided by ARC look to trigger before PLC for corn, grain sorghum and soybeans while PLC offers higher support than ARC for wheat. For corn, ARC support would kick in at a revenue level 1% above the projected revenue based on the projected price and benchmark yield while PLC support would kick in with about a 3% drop in price. For grain sorghum, ARC would kick in a revenue levels 6% above current projections while PLC would kick in with any decline in price. For soybeans, it would take a 4% drop in revenue to trigger ARC versus a 7% drop in price to trigger PLC. For wheat, it would take a% drop in revenue to trigger ARC versus a 2% drop in price to trigger PLC.
Looking at the support levels for 2027 and comparing the projected trigger levels offers insight on how quickly the ARC or PLC programs may provide support to producers. It doesn’t provide a full analysis of how much support the programs offer against downside risk below projections or below their respective support levels.
PLC offers downside protection for price losses below the effective reference price all the way down to the marketing loan rate. This deep price protection effectively insulates producers from further price losses once the program triggers, but only on payment yields that are a percentage of expected production and only on 85% of base acres and only to the extent that base acres reflect planted acres. The PLC program does not offer full protection from price or revenue losses on the crop you are actually growing and producers will want to make informed production, insurance, and marketing decisions as well to protect their operation and their risk exposure.
ARC offers downside protection for revenue losses below the guarantee of 90% of the benchmark yield times the benchmark price. It may better protect shallow losses before other programs or insurance would kick in, but it is also limited. The maximum ARC payment rate is 12% of the benchmark revenue, thus ARC effectively protects revenue from 90% down to 78% of the benchmark revenue. That revenue protection may be more effective for producers, but it too is paid on just 85% of base acres (65% in the case of ARC-IC), so it doesn’t offer complete protection on the acres you actually grow. Crop insurance policies like Revenue Protection (RP) may look like an effective complement to ARC with ARC covering some of what might be the RP deductible. Newer supplemental crop insurance policies like the Supplemental Coverage Option (SCO) or Enhanced Coverage Option (ECO) may even look like substitutes for ARC given the county-based coverage available up to 90% or 95% protection.
Even then, producers will need to consider that ARC or PLC protect producers from revenue or price losses against support levels tied to minimum or moving average levels that are designed to change slowly from year to year. Crop insurance and marketing decisions are tied to current-year price levels and opportunities. In a rising market, crop insurance and marketing decisions could outweigh farm program decisions in terms of the level of support provided, even as they cost the producer in terms of premiums or fees. In a falling market, ARC and PLC may provide more support, even as the support is tied to base acres and a portion of production.
Of course, between now and the March deadline, there could be substantial developments that impact market expectations and in turn expectations for support under either ARC or PLC. In the end, producers will need to make enrollment decisions based on the support and downside risk protection provided by the programs and integrate that decision with their other risk management decisions about crop insurance and marketing to effectively manage their operation for the year ahead.
ARC and PLC Decision Tools
There are online decisions tools available that can help producers analyze the ARC versus PLC decision, even if they fall short of analyzing the full portfolio of production, farm program, insurance, and marketing decisions. These tools, developed during the original roll-out of ARC and PLC following the 2014 Farm Bill are available at the following websites:
- Agricultural and Food Policy Center, Texas A&M University - afpc.tamu.edu/tools
- Farmdoc, University of Illinois - farmdoc.illinois.edu/policy-toolbox
- AgManager, Kansas State University - agmanager.info/ag-policy/farm-bill-0/tradeoff-between-20262027-arc-and-plc
The decision tools from Texas A&M and Illinois provide stochastic, or probability-based analysis of ARC-CO and PLC payments. Both sites also provide links to spreadsheets that can analyze the intricate details of the ARC-IC option. The spreadsheet from Kansas State University provides an illustration of ARC-CO and PLC payments under different price and yield scenarios but doesn’t attach any probability to the potential outcomes. There is also important information from FSA on ARC and PLC program details, including ARC benchmark revenue and guarantee levels by county, crop, and practice on the FSA webpage for the ARC and PLC program at www.fsa.usda.gov/resources/income-support/arc-plc and the webpage for program data at www.fsa.usda.gov/resources/programs/arc-plc/program-data.
Considering multiple tools to analyze the programs and to consider the likelihood of payments may be the best investment of time for producers looking to make an informed farm program decision. Additional analysis and details are available on the Center for Agricultural Profitability website at cap.unl.edu along with other information on educational webinars and programs from Nebraska Extension.
Citation
Lubben, B. “Farm Program Payments and Decisions: Further Analysis.” CAP Series 26-1001, Center for Agricultural Profitability, University of Nebraska-Lincoln, Oct. 9, 2026. DOI: 10.32873/unl.dc.cap090.


