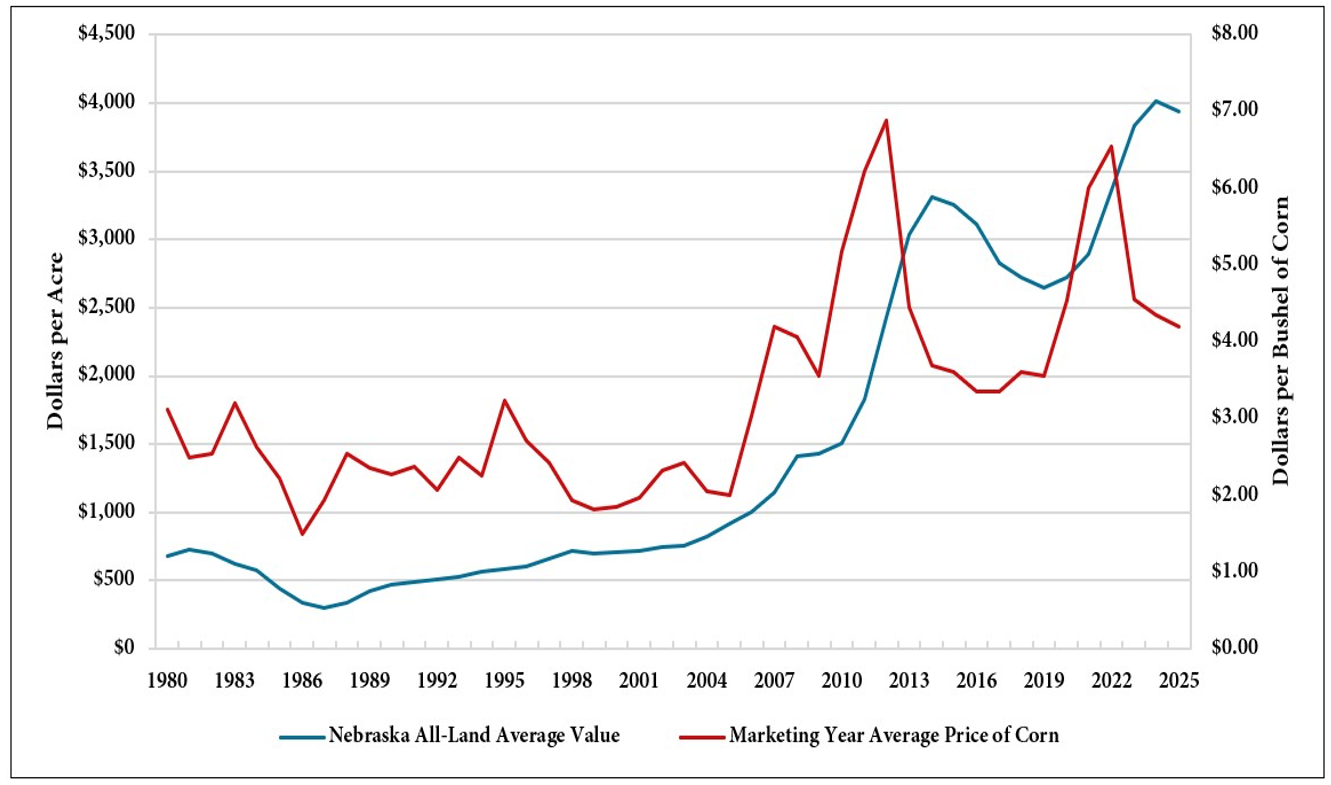
Nebraska’s average agricultural land value declined in 2025 for the first time in six years, falling 2% to $3,935 an acre, according to the final report from the University of Nebraska-Lincoln’s 2024-2025 Farm Real Estate Market Survey.
The decline comes as Nebraska crop producers face growing financial pressures. Following years of rising farm income, the land market is beginning to reflect recent realities like lower crop revenues, elevated production costs and higher interest rates, according to Jim Jansen, an agricultural economist with Nebraska Extension who coordinates the annual report.
“Crop producers are dealing with pressure on their margins,” said Jansen. “The combined effect of softer commodity markets and higher costs is being reflected in what people are willing to pay for different types of cropland.”
Figure 1. Historical Nebraska All-Land Average Value per Acre and Marketing Year Average Price of Corn, Selected Years 1980-2025.
The report details how land values vary by region of the state and by land type. Grazing land showed modest gains, reflecting ongoing demand driven by higher livestock prices, while irrigated and dryland cropland experienced declines in many parts of the state. Jansen said that the differences in crop and livestock profitability may continue to be reflected in the market value of each industry’s land classes.
“Higher cattle prices have helped support the value of grazing land, while lower crop prices and tighter margins are putting pressure on cropland values,” Jansen said. “We expect these market dynamics to continue influencing land values across different regions and land classes in Nebraska.”
Figure 2. Average Value Per Acre of Nebraska Agricultural Land as of Feb. 1, 2025, and Percent Change from Prior Year.
Cropland vs. pasture rental rates
Cash rental rates for cropland trended lower across the state, down between 1% and 7% compared to last year. The productivity of rented cropland — including the type of soil, expected rainfall and local market — contributed to regional cash rental rates, according to survey panel members.
Pasture rental rates declined by 1% in the central region but saw modest gains across the rest of the state, increasing between 1% and 5% over the prior year. These rates were driven by stronger cattle markets and demand for grazing land. Cow-calf and stocker monthly rental rates also trended steady to higher across the state in 2025.
The financial pressures for many landowners and tenants from rising crop input expenses, combined with higher borrowing costs, are putting increased emphasis on risk management and lease flexibility. Jansen noted that clear communication between landowners and tenants, particularly about weather-related terms in a lease, is essential.
“Provisions regarding drought in grazing land leases need to be reviewed by the appropriate agency or organization providing disaster assistance for pasture or range to ensure the property remains eligible in the event of adverse weather patterns,” he said.
Hunting leases provide additional income
Each year, the Nebraska Farm Real Estate Market Survey Report provides a special feature section, analyzing topics related to new or emerging issues in the state’s agricultural land industry. This year’s report looks at the role of hunting leases as a growing source of income. Landowners who have not already granted hunting rights to their tenant(s) may lease exclusive rights to third parties to hunt certain types of wild game on their land.
Approximately 49% of wild game leases in Nebraska this year were for antelope or deer. Pheasants, turkey, waterfowl and other game constituted 17%, 13%, 19% and 2%, respectively.
Table 1. Hunting Lease Comparison for Wild Game in 2025, by Agricultural Statistics District in Nebraskaa.
Average Percent Distribution | |||||
Agricultural Statistics District | Antelope or Deer | Pheasants or Quail | Turkey | Waterfowl | Other Game |
Percent | |||||
| Northwest | 41 | 18 | 6 | 35 | 0 |
| North | 57 | 5 | 24 | 9 | 5 |
| Northeast | 53 | 21 | 6 | 17 | 3 |
| Central | 45 | 9 | 14 | 31 | 1 |
| East | 48 | 17 | 9 | 24 | 2 |
| Southwest | 34 | 29 | 12 | 18 | 7 |
| South | 42 | 24 | 21 | 13 | 0 |
| Southeast | 54 | 15 | 19 | 8 | 4 |
| State | 49 | 17 | 13 | 19 | 2 |
Survey panelists reported that hunting lease provisions, contract duration and the type of wild game found on a property all affect the value of a hunting lease. Different types of vegetation, conservation practices or topography features may also influence it. As for annual income, 62% of hunting leases in Nebraska were reported to generate up to $2,499 a year; 29% generated $2,500 to $4,999; 8% generated $5,000 to $9,999; and 1% generated over $10,000.
“Recreational leases continue to add value for many landowners, especially in areas with good wildlife habitat,” Jansen said. “These leases can help diversify income and offset some of the expenses associated with land ownership.”
About the Nebraska Farm Real Estate Market Survey
The final 2024-2025 Nebraska Farm Real Estate Market Survey and Report was published June 30 by the Center for Agricultural Profitability at Nebraska. It features updated land values, cash rental rates and other detailed information important to land industry participants in the state. The report is the final product of an annual survey of land professionals, including appraisers, agricultural bankers and farm and ranch managers.
The full report is available on the Center for Agricultural Profitability’s website at https://cap.unl.edu/realestate.