At a Glance
- The 2026 sign-up deadline for Pasture, Rangeland, Forage insurance is Dec. 1, 2025.
- PRF is based on NOAA rainfall data and helps livestock producers manage drought risk.
- National PRF participation has more than doubled since 2019, covering over 296 million acres in 2024.
- On average, producers received $2.19 in indemnities for every $1 paid in premiums from 2019–2024.
- Producers should use RMA’s PRF Rainfall Index Decision Support Tool to evaluate options and develop long-term coverage strategies.
A webinar covering PRF strategies and performance for Nebraska producers was held on Oct. 2, 2025. The recording is here.
This article was first published Oct. 1, 2025, by RightRisk News.
The sign-up deadline for Pasture, Rangeland, Forage (PRF) insurance coverage in calendar year 2026 is December 1, 2025. PRF insurance is a rainfall index insurance policy based on precipitation data in grids of 0.25 degrees longitude by 0.25 degrees latitude. The data is provided by the National Oceanic and Atmospheric Administration Climate Prediction Center (NOAA CPC) and dates back over 70 years. The last decade has seen strong growth in the use of PRF as livestock producers across the country who depend on perennial grass production have used it to manage the risk of drought.
PRF National Adoption and Results (2019-2024)
In 2024, producers insured over 296 million acres with PRF insurance across the nation (Table 1). Over the past six years, since 2019, the number of PRF policies, acres covered, and total premiums paid have more than doubled. PRF has evolved into a regular part of annual business activities for many livestock producers with perennial grass pasture and rangeland. Over those six years, the average number of acres covered per policy was 4,812 with the average producer premium per policy of $9,985 or $2.08 per acre. Ninety-two percent of policies earning premium also earned an indemnity payment, with the average indemnity per policy of $21,854 or $4.54 per acre. This results in a producer loss ratio of 2.19, meaning that for every $1 in producer premiums, about $2.19 were paid on average (producer loss ratio = producer indemnities ÷ producer-paid premiums).
Table 1: Pasture, Rangeland, Forage (PRF) insurance national summary of business 2019-2024.
| Crop Year | Policies Earning Premium | Policies Indemnified | Acres | Total Premiums | Total Subsidies | Total Indemnities | Producer Loss Ratio |
| 2019 | 32,118 | 24,713 | 140,054,736 | $ 581,191,717 | $ 310,194,464 | $ 363,315,873 | 1.34 |
| 2020 | 32,634 | 29,999 | 159,606,067 | $ 674,503,145 | $ 359,426,915 | $ 886,723,738 | 2.81 |
| 2021 | 39,655 | 37,511 | 202,163,561 | $ 859,331,457 | $ 457,623,718 | $ 982,025,073 | 2.44 |
| 2022 | 46,761 | 45,157 | 247,382,293 | $ 1,067,154,103 | $ 567,677,551 | $ 1,431,300,078 | 2.87 |
| 2023 | 60,930 | 57,276 | 289,961,667 | $ 1,333,342,857 | $ 706,717,033 | $ 1,123,181,919 | 1.79 |
| 2024 | 65,532 | 61,629 | 296,657,033 | $ 1,398,575,793 | $ 740,443,114 | $ 1,280,699,475 | 1.95 |
| 2019-24 Average | 46,272 | 42,714 | 222,637,560 | $ 985,683,179 | $ 523,680,466 | $ 1,011,207,693 | 2.19 |
Source: USDA-RMA, Summary of Business, October 1, 2025
Actuarial Context and Producer Economics
Federal crop insurance programs are tasked with charging actuarially sound premium rates. In Table 1, this is reflected by total premiums, on average, being very close to total indemnities over the six-year period for all PRF policies earning premium across the nation. However, because the premium subsidies averaged 53% of total premiums over the period, the indemnities received by producers were more than double the producer-paid premiums.
Regional Performance: Where PRF Paid and Why
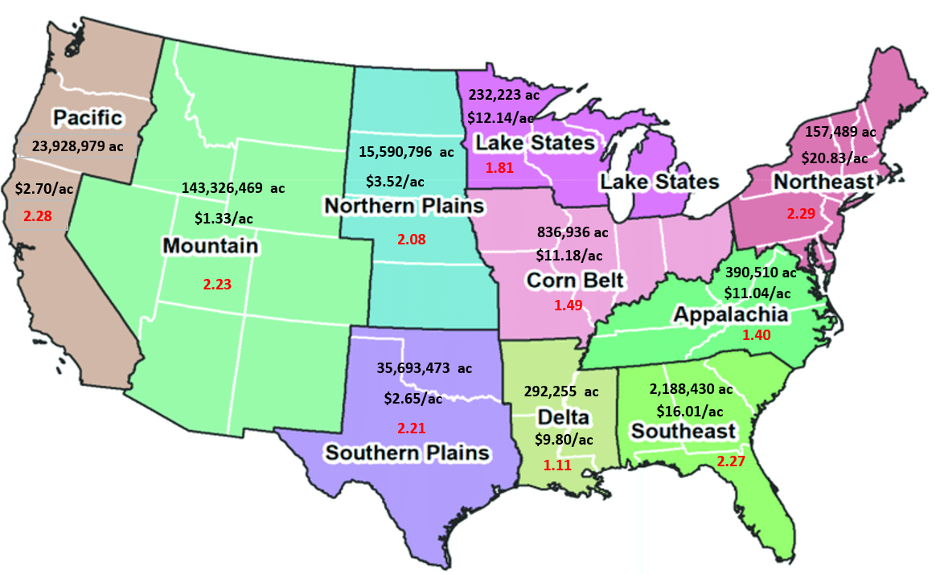
The producer loss ratio varies by year from a low of 1.34 in 2019 to a high of 2.87 in 2022. Similarly, the loss ratios vary across regions over short periods of time. As shown in Figure 1, the producer loss ratio was highest over the six-year period from 2019-2024 in the Northeast (2.29) and in the Pacific (2.28) regions. It was the lowest in the Delta (1.11) region. It was above 2.0 in six of the ten regions.
Most PRF-insured acres are in the western half of the U.S., with the large 11-state Mountain region leading the way with an average of over 143 million acres insured per year over the six-year time span. The fewest acres insured in any region were in the Northeast, with an average of 157,489. However, in addition to having the highest producer loss ratio, the Northeast region also had the highest producer premium per acre at $20.83, compared to the lowest premium per acre of $1.33 in the Mountain region where the most acres were insured.
Figure 1: National Pasture, Rangeland, Forage (PRF) average insured acres per year, average producer premium per acre, and producer loss ratios (in red) for 2019-2024 across the ten USDA crop production regions.
Deciding for 2026: Coverage, Timing, and Tools
PRF insurance provides producers with the opportunity to insure 70% to 90% of the Expected Grid Index Precipitation in 5% increments across a series of two-month intervals throughout the calendar year. Premium subsidies range from 51% to 59%, depending on the coverage level selected with 90% coverage receiving the lowest subsidy percentage and 70% to 75% coverage receiving the highest subsidy percentage while 80% to 85% coverage receives a 55% subsidy rate.
For readers new to PRF: Indemnities trigger when the NOAA CPC grid’s two-month rainfall index falls below your selected coverage level; the shortfall determines payment size. Producers should be strategic in their decision to participate in PRF insurance. Because all policy premiums are calculated to be actuarially sound, over the long term they should produce similar returns per dollar invested regardless of coverage level or months insured. For example, the April-May interval may have a premium rate of 12% or 13% at the 90% rainfall coverage level and a 7% premium rate at the 75% coverage level.
Both are designed to collect premiums that just cover the indemnities paid out over the long run. However, the 75% coverage level would qualify for a 59% subsidy, while the 90% coverage level would qualify for a 51% subsidy. The 75% coverage comes with an extra 15% “deductible” in terms of rainfall deficit. There will be occasions when the 90% coverage pays an indemnity while the 75% coverage does not. Obviously, if an indemnity is paid, the 75% coverage indemnity will be less than the 90% coverage indemnity because of the additional 15% coverage deductible. The coverage level selected is an individual decision that should be chosen strategically based on the producer’s situation and risk preferences, followed by consistent implementation year after year.
National Coverage Experience
Nationally, approximately two-thirds of the PRF policies are at the 90% coverage level (Table 2). An additional one-fourth of the policies are insured at the 85% coverage level, leaving less than 10% of the policies insured with 70% to 80% coverage levels. However, the policies insured at the 75% coverage level make up most of that group, and they insure almost three times the acres per policy as those insured at the 90% coverage.
Similarly, policies insured at the 85% coverage level are twice as large as the policies at the 90% coverage level on an acres-per-policy basis. While it may seem obvious that some producers use the lower coverage to reduce premium cost, it may also be a better strategic fit for their situation. In our experience, lower coverage levels are a good strategic risk-management tool for large rangeland producers worried about severe droughts.
Table 2: Pasture, Rangeland, Forage (PRF) insurance national summary of coverage levels in 2024.
| Cov. Level Percent | Policies Earning Premium | Policies Indemnified | Acres | Total Premiums | Total Subsidies | Total Indemnities | Loss Ratio | Producer Loss Ratio |
| 70% | 546 | 372 | 895,641 | $ 2,618,577 | $ 1,540,670 | $ 2,195,233 | 0.84 | 2.04 |
| 75% | 3,325 | 3,113 | 30,611,175 | $ 88,620,814 | $ 52,218,575 | $ 79,181,748 | 0.89 | 2.18 |
| 80% | 732 | 601 | 2,345,527 | $ 9,815,383 | $ 5,400,389 | $ 8,324,019 | 0.85 | 1.89 |
| 85% | 17,842 | 17,192 | 119,966,081 | $ 488,916,735 | $ 268,875,419 | $ 429,700,519 | 0.88 | 1.95 |
| 90% | 43,087 | 40,351 | 142,838,609 | $ 808,604,284 | $ 412,408,061 | $ 761,297,956 | 0.94 | 1.92 |
| Total | 65,532 | 61,629 | 296,657,033 | $ 1,398,575,793 | $ 740,443,114 | $ 1,280,699,475 | 0.92 | 1.95 |
Source: USDA-RMA, Summary of Business, October 1, 2025
Don't Miss It: Deadline for 2026 Coverage
It is important to do work up front to produce the best policy fit so you can stick with it for several years. RMA offers a PRF Rainfall tool on their website (www.rma.usda.gov) to help put together a policy plan that works for you. Crop insurance agents have similar tools. With the December 1, 2025 sign-up deadline quickly approaching for coverage in 2026, producers interested in purchasing PRF insurance for the first time should begin to explore their options as soon as possible.
Jay Parsons, Risk Management Specialist - University of Nebraska-Lincoln
John Hewlett, Ranch/Farm Management Specialist - University of Wyoming
Jeff Tranel, Ag and Business Management Specialist - Colorado State University
Elliott Dennis, Livestock Marketing Specialist - University of Nebraska-Lincoln