Nebraska Farmland Values and Cash Rental Rates
2022 Preliminary Results
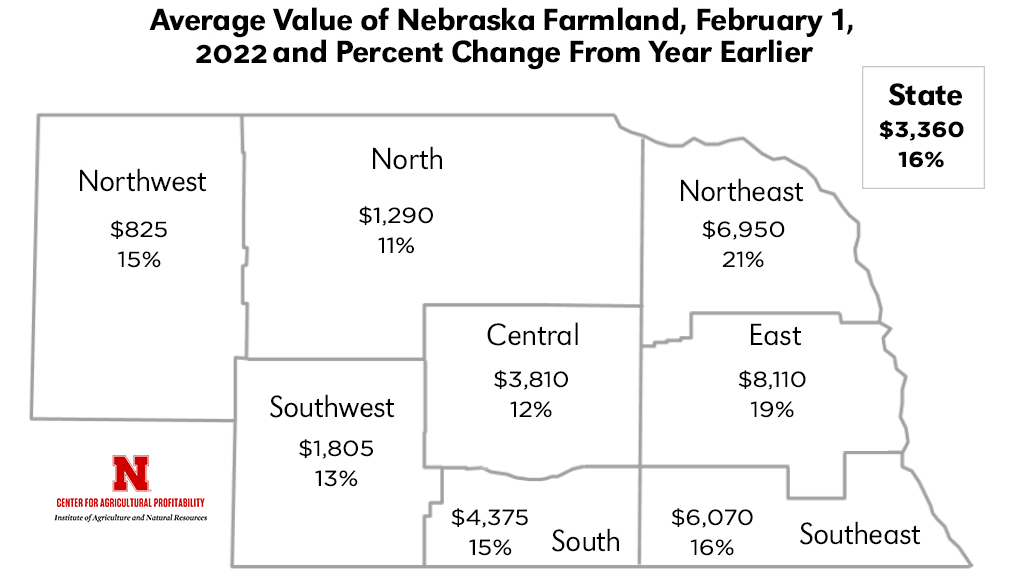
The market value of agricultural land in Nebraska increased by 16% over the prior year, to a statewide average of $3,360 per acre, according to the preliminary report from the University of Nebraska–Lincoln’s 2022 Nebraska Farm Real Estate Market Survey.
Results are published by region and land type below.
The final 2022 survey report will be published in June.
2022 Preliminary Report PDF
2021 Final Report PDF Previous Years
2022 Survey Highlights
- Land industry professionals reported the rise in Nebraska agricultural land values were attributed to higher commodity prices, interest rates near historic lows, hedging against inflation, and a renewed use in 1031 exchanges.
- Cropland represented the highest market value increase for Nebraska for 2022 when compared to the prior year.
- The estimated market value of dryland cropland with irrigation potential rose by 19% across the state.
- Dryland cropland without irrigation potential increased in value by a statewide average of 15%
- Center pivot irrigated cropland averaged 17% higher year over year.
- Gains in the hayland and grazing land markets range from 10% to 13%.
- Cropland cash rental rates trended higher in 2022 over the prior year. Survey participants indicated crop prices as the major factor leading to the growth in rental rates. Higher planting time crop insurance price guarantees led to larger revenue guarantees.
- Grazing land and cow-calf pairs rental rates trended steady to higher across Nebraska in 2022.
Average Value of Nebraska Farmland by Land Type
| Land Type | $/Acre | %Change |
|---|
| All Land Average |
3,360 |
16 |
| Center Pivot Irrigated Cropland |
7,735 |
17 |
| Gravity Irrigated Cropland |
7,055 |
16 |
| Dryland Cropland (Irrigation Potential) |
5,235 |
19 |
| Dryland Cropland (No Irrigation Potential) |
3,900 |
15 |
| Grazing Land (Tillable) |
1,475 |
13 |
| Grazing Land (Nontillable) |
950 |
10 |
| Hayland |
1,895 |
12 |
Due to the inherent limitations of this survey, the information in this report should not be used to set a specific rental rate or value a particular parcel of real property for sale or property taxes, security for a loan, and other related legal matters.
Central
Average Value of Farmland by Land Type
| Land Type | $/Acre | % Change |
|---|
| All Land Average |
3,810 |
12 |
| Center Pivot Irrigated Cropland |
8,105 |
12 |
| Gravity Irrigated Cropland |
7,015 |
14 |
| Dryland Cropland (Irrigation Potential) |
3,855 |
9 |
| Dryland Cropland (No Irrigation Potential) |
3,540 |
15 |
| Grazing Land (Tillable) |
2,160 |
10 |
| Grazing Land (Nontillable) |
1,685 |
13 |
| Hayland |
2,225 |
12 |
Average Cash Rental Rates by Land Type
| Land Type | $/Acre | % Change |
|---|
| Center Pivot Irrigated Cropland |
275 |
17 |
| Gravity Irrigated Cropland |
245 |
14 |
| Dryland Cropland |
120 |
22 |
| Pasture |
41 |
9 |
Average Monthly Cash Rental Rates for Pasture
| Land Type | $/Month |
|---|
| Cow-Calf Pairs |
61.45 |
Counties: Buffalo, Custer, Dawson, Greeley, Hall, Howard, Sherman, Valley
East
Average Value of Farmland by Land Type
| Land Type | $/Acre | % Change |
|---|
| All Land Average |
8,110 |
19 |
| Center Pivot Irrigated Cropland |
10,920 |
15 |
| Gravity Irrigated Cropland |
9,440 |
17 |
| Dryland Cropland (Irrigation Potential) |
8,470 |
24 |
| Dryland Cropland (No Irrigation Potential) |
7,525 |
16 |
| Grazing Land (Tillable) |
3,915 |
16 |
| Grazing Land (Nontillable) |
2,720 |
6 |
| Hayland |
3,470 |
13 |
Average Cash Rental Rates by Land Type
| Land Type | $/Acre | % Change |
|---|
| Center Pivot Irrigated Cropland |
330 |
14 |
| Gravity Irrigated Cropland |
285 |
10 |
| Dryland Cropland |
235 |
7 |
| Pasture |
55 |
6 |
Average Monthly Cash Rental Rates for Pasture
| Land Type | $/Month |
|---|
| Cow-Calf Pairs |
58.35 |
Counties: Butler, Cass, Colfax, Dodge, Douglas, Hamilton, Lancaster, Merrick, Nance, Polk, Sarpy, Saunders, Seward, Washington, York
North
Average Value of Farmland by Land Type
| Land Type | $/Acre | % Change |
|---|
| All Land Average |
1,290 |
11 |
| Center Pivot Irrigated Cropland |
4,890 |
14 |
| Gravity Irrigated Cropland |
4,205 |
11 |
| Dryland Cropland (Irrigation Potential) |
2,245 |
7 |
| Dryland Cropland (No Irrigation Potential) |
1,830 |
11 |
| Grazing Land (Tillable) |
1,370 |
15 |
| Grazing Land (Nontillable) |
745 |
7 |
| Hayland |
1,370 |
14 |
Average Cash Rental Rates by Land Type
| Land Type | $/Acre | % Change |
|---|
| Center Pivot Irrigated Cropland |
230 |
9 |
| Gravity Irrigated Cropland |
195 |
8 |
| Dryland Cropland |
65 |
15 |
| Pasture |
30 |
11 |
Monthly Cash Rental Rates for Pasture
| Land Type | $/Month |
|---|
| Cow-Calf Pairs |
67.05 |
Counties: Arthur, Blaine, Boyd, Brown, Cherry, Garfield, Grant, Holt, Hooker, Keya Paha, Logan, Loup, McPherson, Rock, Thomas, Wheeler
Northeast
Average Value of Farmland by Land Type
| Land Type | $/Acre | % Change |
|---|
| All Land Average |
6,950 |
21 |
| Center Pivot Irrigated Cropland |
10,135 |
24 |
| Gravity Irrigated Cropland |
8,960 |
22 |
| Dryland Cropland (Irrigation Potential) |
7,485 |
20 |
| Dryland Cropland (No Irrigation Potential) |
6,965 |
21 |
| Grazing Land (Tillable) |
3,645 |
12 |
| Grazing Land (Nontillable) |
2,470 |
16 |
| Hayland |
3,475 |
8 |
Average Cash Rental Rates by Land Type
| Land Type | $/Acre | % Change |
|---|
| Center Pivot Irrigated Cropland |
340 |
11 |
| Gravity Irrigated Cropland |
300 |
7 |
| Dryland Cropland |
245 |
9 |
| Pasture |
69 |
4 |
Average Monthly Cash Rental Rates for Pasture
| Land Type | $/Month |
|---|
| Cow-Calf Pairs |
65.80 |
Counties: Antelope, Boone, Burt, Cedar, Cuming, Dakota, Dixon, Knox, Madison, Pierce, Stanton, Thurston, Wayne
Northwest
Average Value of Farmland by Land Type
| Land Type | $/Acre | % Change |
|---|
| All Land Average |
825 |
15 |
| Center Pivot Irrigated Cropland |
3,065 |
19 |
| Gravity Irrigated Cropland |
2,520 |
13 |
| Dryland Cropland (Irrigation Potential) |
855 |
12 |
| Dryland Cropland (No Irrigation Potential) |
745 |
17 |
| Grazing Land (Tillable) |
625 |
16 |
| Grazing Land (Nontillable) |
510 |
15 |
| Hayland |
830 |
7 |
Average Cash Rental Rates by Land Type
| Land Type | $/Acre | % Change |
|---|
| Center Pivot Irrigated Cropland |
175 |
16 |
| Gravity Irrigated Cropland |
130 |
13 |
| Dryland Cropland |
33 |
11 |
| Pasture |
14 |
7 |
Average Monthly Cash Rental Rates for Pasture
| Land Type | $/Month |
|---|
| Cow-Calf Pairs |
43.15 |
Counties: Banner, Box Butte, Cheyenne, Dawes, Deuel, Garden, Kimball, Morrill, Scotts Bluff, Sheridan, Sioux
South
Average Value of Farmland by Land Type
| Land Type | $/Acre | % Change |
|---|
| All Land Average |
4,375 |
15 |
| Center Pivot Irrigated Cropland |
7,780 |
13 |
| Gravity Irrigated Cropland |
6,865 |
19 |
| Dryland Cropland (Irrigation Potential) |
4,145 |
15 |
| Dryland Cropland (No Irrigation Potential) |
3,485 |
14 |
| Grazing Land (Tillable) |
2,290 |
15 |
| Grazing Land (Nontillable) |
1,575 |
8 |
| Hayland |
2,085 |
9 |
Average Cash Rental Rates by Land Type
| Land Type | $/Acre | % Change |
|---|
| Center Pivot Irrigated Cropland |
280 |
19 |
| Gravity Irrigated Cropland |
245 |
17 |
| Dryland Cropland |
100 |
20 |
| Pasture |
40 |
5 |
Average Monthly Cash Rental Rates for Pasture
| Land Type | $/Month |
|---|
| Cow-Calf Pairs |
51.20 |
Counties: Adams, Franklin, Furnas, Gosper, Harlan, Kearney, Phelps, Webster
Southeast
Average Value of Farmland by Land Type
| Land Type | $/Acre | % Change |
|---|
| All Land Average |
6,070 |
16 |
| Center Pivot Irrigated Cropland |
9,985 |
19 |
| Gravity Irrigated Cropland |
7,630 |
14 |
| Dryland Cropland (Irrigation Potential) |
6,695 |
18 |
| Dryland Cropland (No Irrigation Potential) |
5,515 |
12 |
| Grazing Land (Tillable) |
3,265 |
9 |
| Grazing Land (Nontillable) |
2,510 |
17 |
| Hayland |
3,125 |
11 |
Average Cash Rental Rates by Land Type
| Land Type | $/Acre | % Change |
|---|
| Center Pivot Irrigated Cropland |
315 |
13 |
| Gravity Irrigated Cropland |
260 |
9 |
| Dryland Cropland |
190 |
12 |
| Pasture |
53 |
8 |
Average Monthly Cash Rental Rates for Pasture
| Land Type | $/Month |
|---|
| Cow-Calf Pairs |
57.40 |
Counties: Clay, Fillmore, Gage, Jefferson, Johnson, Nemaha, Nuckolls, Otoe, Pawnee, Richardson, Saline, Thayer
Southwest
Average Value of Farmland by Land Type
| Land Type | $/Acre | % Change |
|---|
| All Land Average |
1,805 |
13 |
| Center Pivot Irrigated Cropland |
4,900 |
18 |
| Gravity Irrigated Cropland |
4,155 |
10 |
| Dryland Cropland (Irrigation Potential) |
1,775 |
10 |
| Dryland Cropland (No Irrigation Potential) |
1,560 |
8 |
| Grazing Land (Tillable) |
1,055 |
11 |
| Grazing Land (Nontillable) |
825 |
9 |
| Hayland |
1,535 |
17 |
Average Cash Rental Rates by Land Type
| Land Type | $/Acre | % Change |
|---|
| Center Pivot Irrigated Cropland |
225 |
15 |
| Gravity Irrigated Cropland |
180 |
6 |
| Dryland Cropland |
49 |
18 |
| Pasture |
25 |
12 |
Average Monthly Cash Rental Rates for Pasture
| Land Type | $/Month |
|---|
| Cow-Calf Pairs |
56.70 |
Counties: Chase, Dundy, Frontier, Hayes, Hitchcock, Keith, Lincoln, Perkins, Red Willow
About the Nebraska Farm Real Estate Market Survey
The Nebraska Farm Real Estate Market Survey is an annual survey of land professionals, including appraisers, farm and ranch managers and agricultural bankers. It is conducted by the Center for Agricultural Profitability, which is based in the Department of Agricultural Economics at the University of Nebraska-Lincoln. Results from the survey are divided by land class and agricultural statistic district. Land values and rental rates presented in the report are averages of survey participants’ responses by district. Actual land values and rental rates may vary depending upon the quality of the parcel and local market for an area. Preliminary land values and rental rates are subject to change as additional surveys are returned.