The beginning of the year is busy for businesses in finalizing records and filing annual income taxes. Farm and ranch operations are no exception. Beyond the net income or loss showing on the farm’s Schedule F, analyzing the true picture of the operation’s net farm income, and earned net worth change for the year is important.
Preparing an income statement using accrual adjustments will tell us more about the operation’s profitability and performance beyond what income tax statements provide. The income statement tells the story of revenue, expenses, and depreciation between the beginning of year balance sheet and the end of the year balance sheet. Hence, an important use of an income statement is to relate true profitability from the beginning of the period to the end as we observe changes in the balance sheets.
Farm accounting is most often done on a cash basis. Making necessary accrual adjustments to the cash accounting figures at the end of a year, along with adjusting the annual depreciation expense used on the Schedule F for tax purposes to actual use or what some refer to as “management” depreciation, assists in calculating true net farm income, otherwise known as profit (or loss in some cases). The net farm income figure is key in the relationship between earned net worth changes on the balance sheet.
Depreciation Adjustment
In many cases, the depreciation expense figure used on the Schedule F form is different from actual use depreciation due to the IRS Section 179 rule, allowing qualified business owners a deduction up to the total amount of a capital purchase, providing an instant expense deduction that helps in lowering taxes in a given year. Keep in mind that limits on Section 179 and accelerated tax depreciation rules can change from time to time based on current tax law.
When figuring actual usage or management depreciation, the calculation is the original purchase price of the asset, minus an estimated salvage value for the item, then figuring the value of that asset in proportion to its “useful life” each year until the salvage value is reached. For example, a $50,000 wagon with a useful life of 10 years and a salvage value estimated at $20,000 would be $3,000 per year in depreciation ($50,000 - $20,000)/10 years = $3,000 per year. On a cost basis balance sheet when new, the wagon would be shown as a $50,000 asset and at the end of the year, it would be valued at $47,000. On the next year end balance sheet, the wagon would be $44,000 in value on the books.
Inventory Adjustments
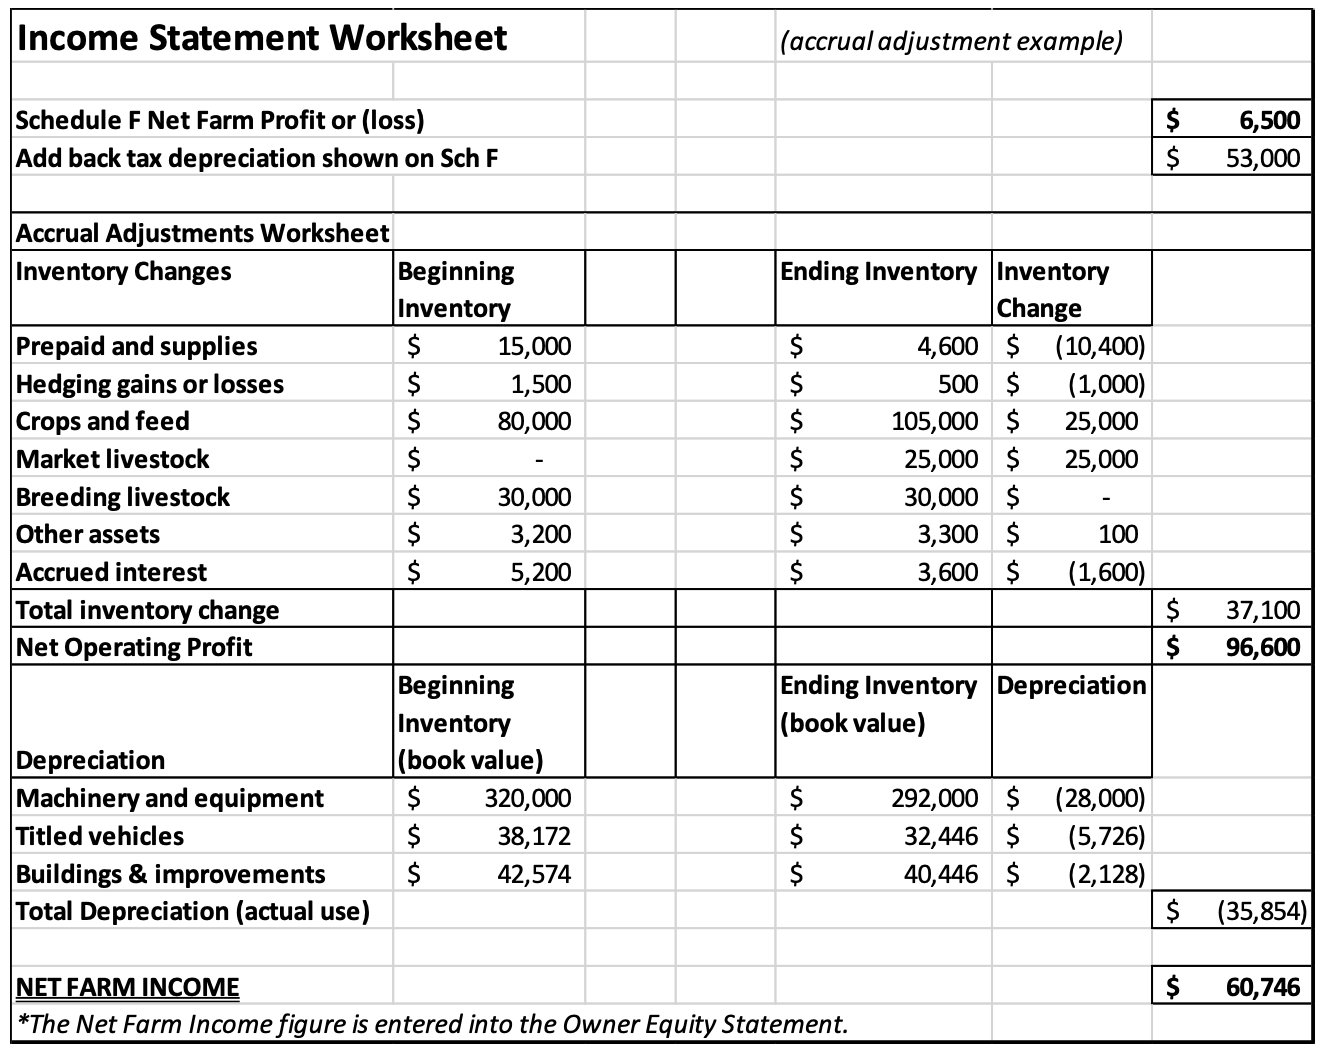
Next, beginning and ending year inventory changes need to be considered in calculating an accrual adjusted net farm income figure. Net income should include a measure of the value of production for year and the expenses that relate to that production period. A farm’s cash accounting records might show selling $80,000 of the previous year’s crop along with just $30,000 of this year’s production, leaving $105,000 in year end crop inventory as shown in income statement adjustment worksheet example shown (Figure 1). In this same example, all the weaned calves were sold before the first of the year, therefore raised livestock inventory on the beginning balance sheet and on the Figure 1 worksheet, is zero. Then during the year being analyzed, the calves raised are all still in inventory at a $25,000 value at yearend. By figuring these accrual adjustments, net farm income, otherwise known as “true” or real profitability is calculated for a given period.
Figure 1. Income Statement Example

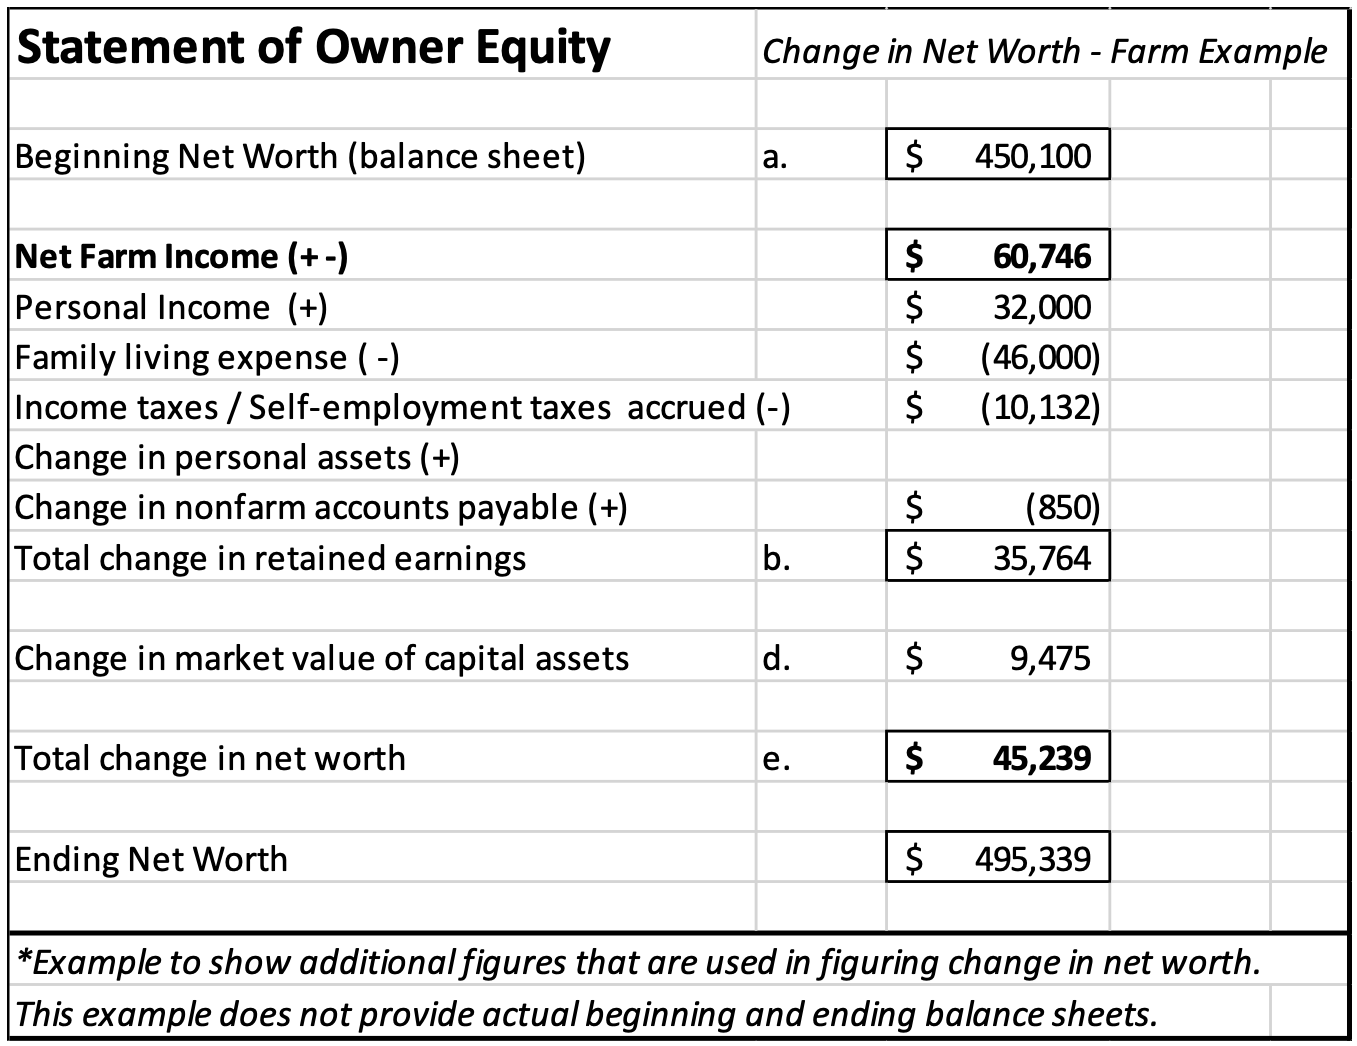
The net farm income amount is used in the Statement of Owner Equity (Figure 2) along with personal income, family living, income and self-employment taxes paid to reach a “total change in retained earnings” figure, then if needed, adding in a change in the market value of capital assets noted on the balance sheets to determine actual net worth growth or change from the beginning of the accounting year to the end of the year.
Figure 2. Statement of Owner Equity Example

In the example presented, the Schedule F Form indicated a positive $6,500 net farm profit. After the $53,000 depreciation figure adjustment and positive inventory change of $37,100 minus the actual use depreciation calculation of $35,854, net farm income for the year is $60,746. This is $54,246 more than the Schedule F indicated.
Net Farm Income and Net Worth Change
Net farm income along with non-farm wages and earnings should be positive enough to cover family living expenses or owner withdrawals along with self-employment and income taxes, with the difference being what is available to reinvest into the operation or in other words, grow the operation’s net worth. If year after year, net farm income falls short, and net worth erodes, the financial stability of the operation will become of concern.


