Commodity prices have risen over the last several months, and so have major input expenses, such as fuel, fertilizer, and even the price of pesticides. When crop prices rise, profits do not always follow incrementally. The whole enterprise picture must be brought into focus, accounting for input price and expense adjustments that may offset gains on the revenue side of the budgets. Staying current with cost of production and breakeven estimates using enterprise budgeting provides information that is useful when making management decisions such as input selection, production considerations or marketing the crop.
Hindsight would tell us this year that pre-paying for crop inputs may have been wise going from 2020 to 2021, even after factoring in carrying or opportunity costs during the pre-pay period. A year ago, the reverse would have been true, considering fuel prices alone. Near the end of 2019, fuel prices were high then dropped during the first half of 2020. The opposite trend occurred going into 2021. As we researched prices for the 2021 crop budgets, diesel prices in October 2020 were near $1.50 per gallon, the figure utilized in the 2021 Nebraska crop budgets published by the University of Nebraska–Lincoln’s Department of Agricultural Economics. By the end of March 2021, diesel prices had increased approximately 46% to $2.19 per gallon (non-tax farm delivery for 500 gallons or more). Fertilizer and chemical inputs often follow fuel and oil price increases; therefore, adjustments for projected cost of production for 2021 are necessary.
Using a cost of production calculator like the new UNL Ag Budget Calculator (ABC) Program, or budgets in a spreadsheet format similar to prior years, it is easy to enter price changes for inputs and run different “what if” scenarios. The new ABC program is designed to include revenue projections. Breakeven and sensitivity analysis information is being added into the program, along with a risk module to consider various levels of production, price and insurance coverage scenarios. In any program, it is good practice to plug in your own expenses. These figures should include your own equipment and field operation estimates in addition to materials and services utilized in your cropping practices, allowing you to project more precisely your cost of production per field, enterprise or farm basis.
Ten different crop budgets out of the 83 published by the university for 2021 were selected as examples for the purpose of this discussion. Table 1 shows the cash and total economic cost per unit, including adjusted total costs per acre for those budgets as increased fuel, fertilizer and pesticide prices were entered. Fuel (diesel) costs increased by 46%. Fertilizer price increases varied by the product and ranged, for example, from 33% higher for 11-52-0, to 73% higher for 32-0-0. A 20% price increase was factored in for all other crop pesticides. However, these price adjustments since last fall also varied by product.
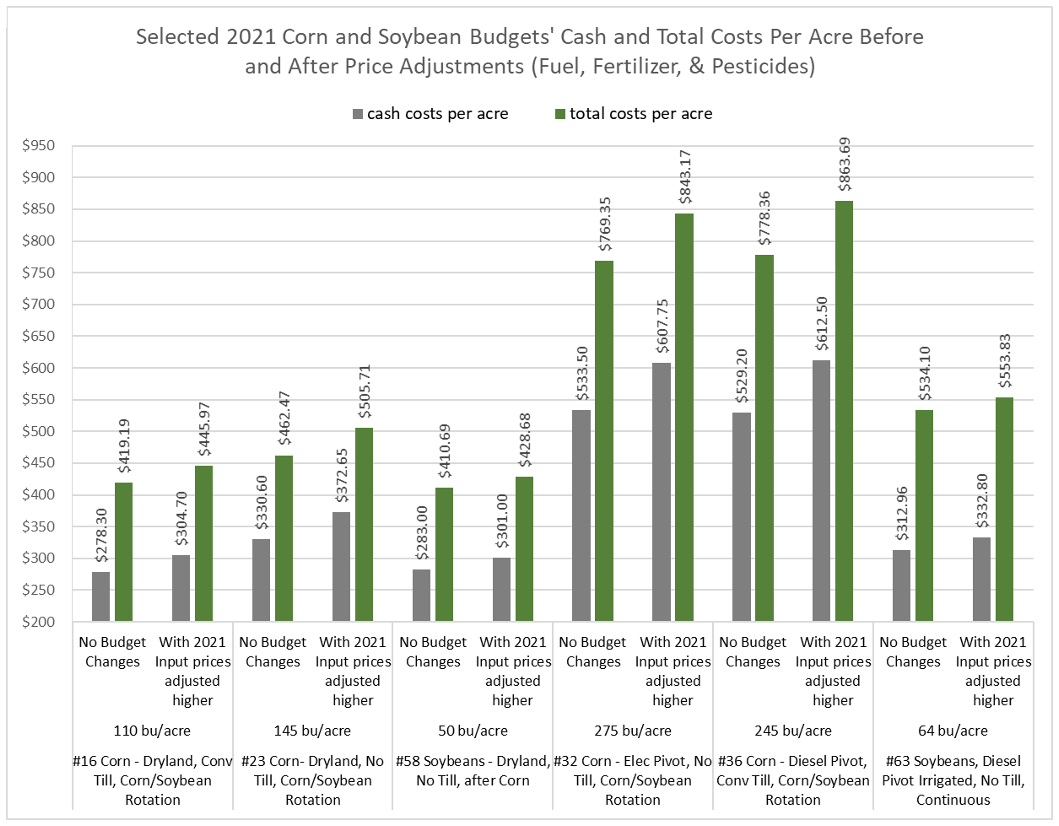
While analyzing cost changes on a percentage basis and comparing corn and soybeans budgets, the increased fuel, fertilizer, and pesticide costs have the greatest impact on the cost of production for corn. The two soybean budget examples both reflect an increase in cash costs by 6% and 4% for total economic costs per bushel when the price adjustments were made. The corn budgets indicate a 9% to 16% increase in cash costs per bushel and ranged from 6% to 11% higher in total economic costs per bushel when the same input costs were factored into the budgets. The primary difference between the enterprises comes from using minimal fertilizer inputs in soybean budgets. Figure 1 shows cash costs and total costs per acre before and after the price increases were added for fuel, fertilizer and pesticides. Two Nebraska dryland corn budgets are shown, along with one dryland soybean budget and two irrigated corn budgets, with one irrigated soybean budget shown for sample comparisons.
Enterprise budgeting should be done annually utilizing a budgeting system that allows for ease in adjusting projected expenses and revenue up or down as the production season progresses. Budgets are prepared for planning purposes and should provide relevant economic information to help producers make management decisions. The University of Nebraska-Lincoln crop and livestock budgets are created using budgeting tools that are meant as guides, allowing producers to enter their own production, expense and sales projections. Creating your own enterprise budgets, keeping projections up-to-date and knowing the cost of production for various enterprises should be worth the time and provide great value as decisions are made throughout the year.
| 2021 UNL Crop Budget | Yield | Cash Costs per Unit1 | Total Economic2 Costs per Unit | Input Cost Increases | Adjusted Cash Costs per Unit | Adjusted Total Economic Costs per Acre | Adjusted Total Economic Costs per Unit | % Increase Economic Costs per Unit |
|---|---|---|---|---|---|---|---|---|
| #16 Corn - Dryland, Conv Till, Corn/Soybean Rotation | 110 bu/acre | $2.53 | $3.81 | Fuel price increase 46%, fertilizer price increases (33 to 73%), + 20% pesticide price increases | $2.77 | $445.97 | $4.05 | 6.3% |
| #23 Corn- Dryland, No Till, Corn/Soybean Rotation | 145 bu/acre | $2.28 | $3.19 | Fuel price increase 46%, fertilizer price increases (33 to 73%), + 20% pesticide price increases | $2.57 | $505.71 | $3.49 | 9.4% |
| #32 Corn - Elec Pivot, No Till, Corn/Soybean Rotation | 275 bu/acre | $1.94 | $2.80 | Fuel price increase 46%, fertilizer price increases (33 to 73%), + 20% pesticide price increases | $2.21 | $843.17 | $3.07 | 9.6% |
| #36 Corn - Diesel Pivot, Conv Till, Corn/Soybean Rotation | 245 bu/acre | $2.16 | $3.18 | Fuel price increase 46%, fertilizer price increases (33 to 73%), + 20% pesticide price increases | $2.50 | $863.69 | $3.53 | 11.0% |
| #41 Dry Beans - Elec Pivot, Reduced Till w/Cover Crop | 27 cwt/acre | $15.98 | $21.13 | Fuel price increase 46%, fertilizer price increases (33 to 73%), + 20% pesticide price increases | $17.38 | $608.12 | $22.52 | 6.6% |
| #46 Grain Sorghum - Dryland, No Till | 135 bu/acre | $1.87 | $2.63 | Fuel price increase 46%, fertilizer price increases (33 to 73%), + 20% pesticide price increases | $2.24 | $405.39 | $3.00 | 14.1% |
| #58 Soybeans - Dryland, No Till, after Corn | 50 bu/acre | $5.66 | $8.21 | Fuel price increase 46%, fertilizer price increases (33 to 73%), + 20% pesticide price increases | $6.02 | $428.68 | $8.57 | 4.4% |
| #63 Soybeans - Diesel Irrigated, No Till, Continuous | 64 bu/acre | $4.89 | $8.35 | Fuel price increase 46%, fertilizer price increases (33 to 73%), + 20% pesticide price increases | $5.20 | $553.83 | $8.65 | 3.6% |
| #67 Sugarbeet, Gravity Irrigated (fed by canal) Zone tillage | 30 tons/acre | $24.47 | $29.51 | Fuel price increase 46%, fertilizer price increases (33 to 73%), + 20% pesticide price increases | $26.19 | $936.77 | $31.23 | 5.8% |
| #75 Winter Wheat, Dryland Southwest, No Till | 55 bu/acre | $3.15 | $4.42 | Fuel price increase 46%, fertilizer price increases (33 to 73%), + 20% pesticide price increases | $3.65 | $270.64 | $4.92 | 11.3% |
Source: University of Nebraska - Lincoln 2021 Nebraska Crop Budgets at https://cap.unl.edu/cropbudgets
1Units are in bushels for all crop enterprises shown here except for budget #41 -Dry Edible Beans is hundredweight (cwt)
2 Economic costs are ownership and opportunity costs for machinery and land utilized in a crop enterprise. Cash costs are labor, repairs, materials, services, interest, cash overhead, and land taxes.
Figure 1