USDA “Certified Organic” is a form of production that has received considerable public attention in the last 10 years, particularly among small, beginning and/or minority farmers. Spiking retail prices for red meat and poultry have seemingly accelerated consumer’s interest in organic locally produced products. Consumers demonstrate their desire for these products by paying premiums when purchasing meat products. Producers receive premiums by either directly marketing live animals to consumers that are custom harvested or marketing animals to meat wholesalers. The primary difference is the way premiums are captured. Producers doing custom harvesting capture the full premium whereas producers selling to meat wholesalers capture a portion of the full premium.
Premiums paid for retail meat are readily available through several publicly available USDA reports. However, premiums paid for organic livestock are difficult to determine since there are not publicly available reports. Since premiums are a result of consumer’s taste preferences and the added costs of production, producers interested in transitioning some or all their production to USDA Certified Organic generally ask 1) what are the requirements for organic production, 2) what do we know about the current level of organic production, and 3) how to fairly price organic products. This article aims to answer these questions.
Certified Organic is a Marketing Strategy
There is a difference between having organic production and being certified organic by the USDA. To use the “USDA Organic” label an operation must be accredited by a state or private entity to ensure that certain production practices are followed. The practices to be followed throughout the animal’s life include: a) raised in a way that accommodates natural behavior such as access to the outdoors, direct sunlight, and dry bedding, b) access to certified organic pasture for the entire grazing season and fed 100% organic feed, d) managed without antibiotics, added growth hormones, or other prohibited feed ingredients, and e) raised per animal health and welfare standards. Specific standards can be found here.
The USDA Organic label allows for livestock or livestock products to be marketed and capture potential premiums in the marketplace. The labels summarize a variety of attributes that are difficult or tedious to describe on the packaging and provides a signal to consumers. The label only adds additional value if consumers know and value the attributes the label represents. Thus, there is a balance between providing quality signals and not overwhelming consumers. For example, within organic production there are four labeling categories: 100 percent organic, organic, “made with” organic ingredients, and specific organic ingredients.
Organic Production in Nebraska Slows
Approximately every five years, the USDA-NASS conducts a nationwide survey on organic production throughout the United States. In 2019, the USDA conducted their 6th comprehensive organic survey. Data is available for each state across a variety of products. In the Fall of 2020, USDA released their report on 2019 organic production. Table 1 below summarizes the number of farms, inventory, and sales of livestock and livestock products in Nebraska. As with all USDA reports, this is a representative sample and may be under- or overrepresented within a year conditional on producer survey response rate.
Nebraska has about 3% of all organic beef cattle operations and 6% of all organic beef cattle inventory in the United States. California (11%), New York (13%), and Wisconsin (13%) have the largest number of farms. California (40%), Nebraska (6%), and Oregon (4%) have the largest beef cow inventory. Beef cattle products are the most common form of livestock and livestock products that are sold at certified organic. All other categories of organic livestock production or livestock products are minimal compared to other states both on an inventory and production level
Nebraska has seen a continual decline in the number of farms that are able to sell certified organic livestock and livestock products. Beef cattle decreased from 24 farms to 18 farms between 2008 and 2019. Dairies with certified organic milk cows decreased from 4 to 2. Fewer farms may be certifying as organic but total inventory has held steady or been increasing. For example, the total number of certified organic beef cows in 2008 was 2375 and 2474 in 2019. While the number of farms decreased total inventory was relatively stable. This would imply that consolidation amongst producers is also happening in organic production.
Pricing Information for Organic Products
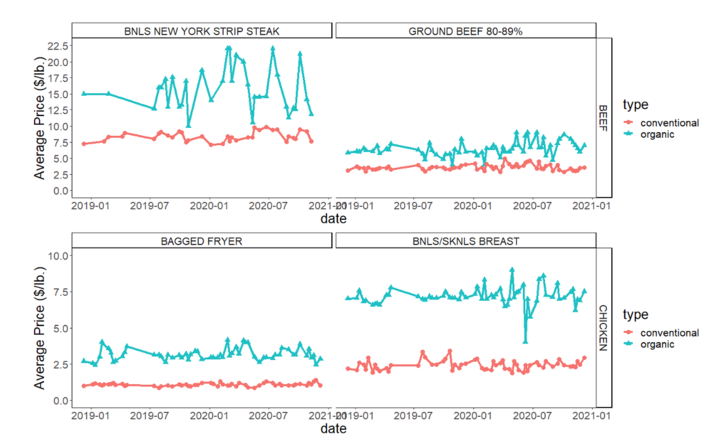
Publicly available USDA reports are one way to track organic premiums on specific products over time and by product type. The most comprehensive of these is found here. Comparing these premiums over time shows that organic premiums for chicken products are much more stable over time compared to beef products. For example, organic boneless and skinless chicken breasts was $7.50 per lb. and $2.50 per lb. for conventional. These prices have been very consistent since 2018. Contrast this with boneless New York Strip Steak which has varied from $10-$20 per lb. since 2018. This price variability implies that organic beef production is much more risky than organic chicken production. Figure 1 shows this variability between two common beef and chicken products.
Determine the Additional Costs and Market Premiums Before Switching
Converting part or all an operation to certified “Organic” is one way to potentially add more profit to an enterprise. Each operation is different so careful analysis of the costs and benefits of switching production practices is clearly warranted prior to making any decisions. When processing the decision to convert production, one of the most common question I receive from producers is “Are consumers willing to pay more for Organic or Local beef over conventional beef?” The answer is generally, it depends but historical evidence says yes.
| Livestock and Livestock Product | Farms | - | - | - | Inventory | - | - | - | Sales ($) | - | - | - |
|---|---|---|---|---|---|---|---|---|---|---|---|---|
| 2008 | 2011 | 2016 | 2019 | 2008 | 2011 | 2016 | 2019 | 2008 | 2011 | 2016 | 2019 | |
| Livestock | ||||||||||||
| Milk Cows | 4 | 3 | - | 2 | 378 | (D) | - | (D) | (D) | 18,417 | - | (D) |
| Beef Cows | 24 | 12 | 7 | 18 | 2,375 | 425 | 1,009 | 2,474 | (D) | 361,266 | 209,575 | 503,132 |
| Other Cattle | 23 | 16 | 7 | 23 | 3,073 | 1,388 | 1,260 | 4,853 | (D) | 535,461 | 656,113 | 4,575,703 |
| Hogs and Pigs | 2 | 1 | 2 | 5 | (D) | (D) | (D) | 276 | (D) | (D) | (D) | 64,485 |
| Sheep and Lambs | 1 | - | - | - | (D) | - | - | - | (D) | - | - | - |
| Goat and Kids | 3 | - | - | - | 305 | - | - | - | (D) | - | - | - |
| Other Livestock | 2 | 1 | 2 | 1 | (D) | - | (D) | (D) | (D) | (D) | (D) | (D) |
| Chicken - Layers | 4 | 2 | - | 5 | 767 | (D) | - | 2,300 | (D) | (D) | - | (D) |
| Chicken - Broilers | 3 | 2 | 1 | 10 | (D) | (D) | (D) | (D) | (D) | (D) | (D) | (D) |
| Turkeys | 1 | 2 | - | - | (D) | (D) | - | - | (D) | (D) | - | - |
| Other Poultry | 1 | - | - | - | (D) | - | - | - | (D) | - | - | - |
| Livestock Products | ||||||||||||
| Cow Milk (lbs.) | 4 | 3 | - | 2 | 2,216,000 | (D) | - | (D) | (D) | (D) | ||
| Wool (lbs.) | - | - | - | - | - | - | - | - | - | - | - | - |
| Goat Milk (lbs.) | - | - | - | - | - | - | - | - | - | - | - | - |
| Chicken Eggs (Dozen) | 2 | 2 | - | 5 | (D) | (D) | - | 25,300 | (D) | (D) | ||
| Other Products | - | - | - | - | - | - | - | - | - | - | - | - |
Source: Various USDA-NASS reports
Note: (D) represents non-reporting due to confidentiality and (-) represents no farms, inventory, or sales were present
Figure 1. Comparing Conventional and Organic Prices for Select Chicken and Beef Retail Products, 2019-2021


